EUR/USD Mid-Session Technical Analysis for March 1, 2018
The EUR/USD is trading lower at the mid-session, but in a tight range as traders prepare for a second day of testimony before a congressional banking committee by U.S. Federal Reserve Chief Jerome Powell.
The early tone suggests investors expect Powell to offer an upbeat tone on the U.S. economy, bolstering bets that the central bank will raise rates at least four times. This would underpin the dollar.
On the other hand, soft inflation data in the Euro Zone has weakened expectations that the European Central Bank will dial back its stimulus this year. This news is putting downside pressure on the Euro.
Daily Technical Analysis
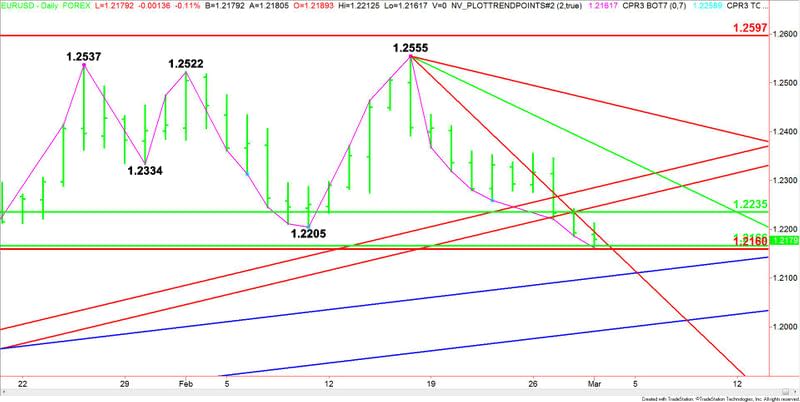
The main trend is down according to the daily swing chart. The trend turned down on Wednesday when sellers took out the previous main bottom at 1.2205.
The EUR/USD is down nine sessions since its last main top at 1.2555 on February 16. This puts it in the window of time for a possible closing price reversal bottom. The chart pattern may not be indicating that the trend is getting ready to turn, but it will suggest the buying is greater than the selling at current price levels, due to oversold conditions.
The main retracement zone is 1.2235 to 1.2160. Inside this zone is a major, long-term 50% level at 1.2166. This area is very critical to the longer-term structure of the chart pattern. Today’s low is 1.2162. This suggests investors are coming in to defend the Euro against a steep sell-off.
Daily Technical Forecast
Based on the early price action, the direction of the EUR/USD the rest of the session will be determined by trader reaction to the Fibonacci level at 1.2160.
Holding above 1.2160 will signal the presence of buyers. This could drive the EUR/USD into a steep downtrending Gann angle at 1.2195. Overcoming this angle could create the upside momentum needed to challenge the 50% level at 1.2235.
Overcoming 1.2235 could drive the Forex pair into a long-term uptrending Gann angle at 1.2246. This angle is a possible trigger point for a surge into the next long-term uptrending Gann angle at 1.2286.
A sustained move under 1.2160 will indicate the presence of sellers. If the selling volume increases, we could see a spike into a long-term uptrending Gann angle at 1.2101. This is the trigger point for an acceleration to the downside.
This article was originally posted on FX Empire
