E-mini S&P 500 Index (ES) Futures Technical Analysis – Headed for 2602.75 Unless Buyers Overtake 2701.75
December E-mini S&P 500 Index futures broke sharply early Thursday after a steady to better opening. Although buyers are trying to claw back earlier losses, the index remains in a weak position ahead of the cash market opening.
The blame for the break can be placed on concerns over U.S.-Chinese trade dispute negotiations. Triggering the latest round of worries was the arrest of the CFO of Huawei, a Chinese corporation.
According to the Eurasia Group, “The arrest and extradition request by the US government represents a new and major escalation in what has been a series of U.S. efforts to hold Chinese companies accountable for violations of U.S. law, some dating back years.”
At 0924 GMT, December E-mini S&P 500 Index futures are trading 2668.50, down 32.25 or -1.22%.
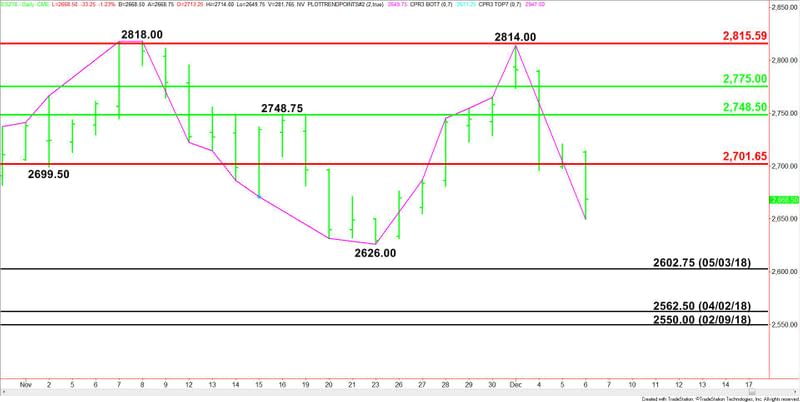
Daily Swing Chart Technical Analysis
The main trend is down according to the daily swing chart. A trade through 2626.00 will reaffirm the downtrend. The main trend will change to up on a move through 2814.00.
The index is also trading on the weak side of a series of major retracement levels, putting it in a bearish position. These levels at 2701.75, 2748.50, 2775.00 and 2815.50 are resistance.
Daily Swing Chart Technical Forecast
Based on the early price action and the current price at 2668.50, the direction of the December E-mini S&P 500 Index the rest of the session is likely to be determined by trader reaction to the Fibonacci level at 2701.75.
Bullish Scenario
In order to generate any upside momentum, buyers are going to have to drive the index back over 2701.75. If the volume increases on the move then look for the rally to possibly extend into the 50% level at 2748.50.
Bearish Scenario
A sustained move under 2701.75 will signal the presence of sellers. The daily chart indicates there is plenty of room to the downside under this level with the nearest targets the November 23 main bottom at 2626.00 and the May 3 main bottom at 2602.75.
Selling pressure could pick up under 2602.75 with the April 2 bottom at 2562.50 and the February 9 bottom at 2550.00 the next targets.
The market could go into a freefall unless it recaptures 2701.75.
This article was originally posted on FX Empire

