E-mini Dow Jones Industrial Average (YM) Futures Technical Analysis – Four Tops From 26145 to 26330 Providing Resistance
June E-mini Dow Jones Industrial Average futures tumbled on Wednesday as fear of a recession lingered. The catalyst behind the selling pressure was another plunge in the benchmark 10-year Treasury yield. The 10-year rate traded at 2.386 percent and hit its lowest level since December 15, 2017. Investors are focusing on yields after the 10-year fell below the 3-month rate last week for the first time since 2007. The pattern, called an inverted yield curve, is often seen as an early indicator of a recession.
On Wednesday, June E-mini Dow Jones Industrial Average futures settled at 25629, down 31 or -0.12%.
Daily Swing Chart Technical Analysis
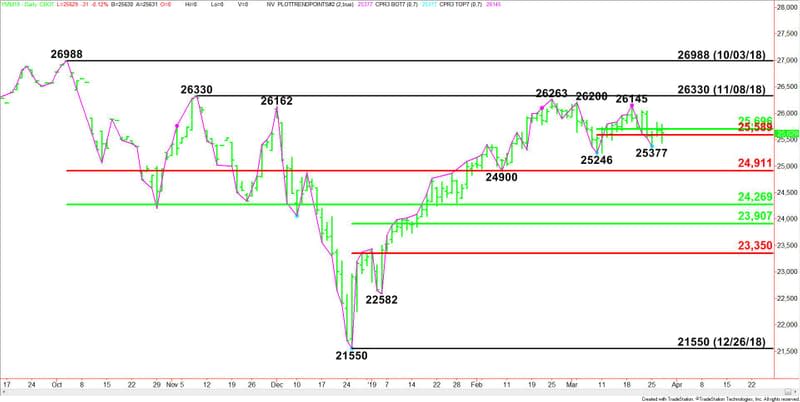
The main trend is down according to the daily swing chart. A trade through 26145 will change the main trend to up. This could lead to a labored rally with potential upside targets coming in at 26200, 26263 and 26300. The latter is the trigger point for an acceleration to the upside.
A move through 25377 will negate a closing price reversal bottom and reaffirm the downtrend. This could lead to a test of main bottoms at 25246 and 24900. The latter is the trigger point for an acceleration to the downside.
The contract range is 26988 to 21550. Its retracement zone at 24911 to 24269 is support. Trading above this area is helping to generate an upside bias.
The main range is the December 2018 to February 2019 rally. The bottom is 21550. The top 26263. Its retracement zone at 23907 to 23350 is the second downside target zone.
The short-term range is 25246 to 26145. Its retracement zone at 25696 to 25589 is currently being straddled.
Daily Swing Chart Technical Forecast
The short-term direction of the June E-mini Dow Jones Industrial Average futures contract is going to be determined by trader reaction to the short-term retracement zone at 25696 to 25589. A sustained move over 25696 will indicate the return of buyers. A sustained move under 25589 will indicate the selling pressure is getting stronger.
If a sustained move over 25696 generates enough upside momentum then look for a drive into the three main tops at 26145, 26200 and 26263. This is followed by the November 8 main top at 26330. This is the trigger point for an acceleration to the upside with the next main target the October 3 main top at 26988.
If a sustained move under 25589 creates enough downside momentum then look for a further break into the reversal bottom at 25377 and the main bottom at 25246. If this bottom fails then look for the selling to extend into the major Fibonacci level at 24911 and the main bottom at 24900.
The main bottom at 24900 is the trigger point for an acceleration into the major 50% level at 24269.
This article was originally posted on FX Empire

