E-mini Dow Jones Industrial Average (YM) Futures Technical Analysis – March 4, 2019 Forecast
March E-mini Dow Jones Industrial Average futures are trading higher on Monday, but backing-off from its early high. Stocks are being underpinned by renewed hopes of a trade deal between the United States and China. However, gains are being capped because of the lack of clarity as to what is actually in the agreement. Furthermore, hardliners on President Trump’s trade negotiation team may want to get more concessions from the Chinese.
At 11:19 GMT, March E-mini Dow Jones Industrial Average futures are trading 26090, up 58 or +0.23%.
Daily Technical Analysis
The main trend is up according to the daily swing chart, however, it is diverging a little from the chart pattern in the March E-mini S&P 500 Index and the March E-mini NASDAQ-100 Index. This could be a sign that the buying is weakening or the selling is getting stronger.
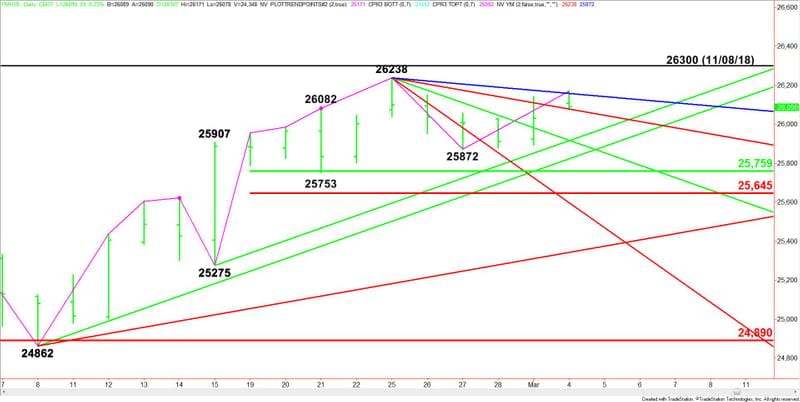
A trade through 26238 will signal a resumption of the uptrend, while a trade through 25872 will change the main trend to down.
The short-term range is 25275 to 26238. If the main trend changes to down then its retracement zone at 25759 to 25645 will become the primary downside target.
Daily Technical Forecast
Based on the early price action, the direction of the March E-mini Dow Jones Industrial Average futures contract on Monday is likely to be determined by trader reaction to the downtrending Gann angle at 26158.
Bullish Scenario
A sustained move over 26158 will indicate the presence of buyers. If this move creates enough upside momentum then look for a test of 26238. Taking out this top is likely to fuel an extension of the rally into the November 8 main top at 26300.
Bearish Scenario
A sustained move under 26158 will signal the presence of sellers. This could lead to a test of the next downtrending Gann angle at 26078. This price is a potential trigger point for an acceleration to the downside with the next target a potential support cluster at 25918 to 25915.
If 25915 fails as support then look for the selling to possibly extend into the uptrending Gann angle at 25822, followed by the 50% level at 25759.
This article was originally posted on FX Empire

