E-mini Dow Jones Industrial Average (YM) Futures Technical Analysis – Trader Reaction to 25761 – 25852 Will Set Near-Term Tone
June E-mini Dow Jones Industrial Average futures are trading higher during the pre-market session on Friday. The rally is being driven by optimism over the U.S.-China trade negotiations. Rising U.S. Treasury yields are also helping to dampen concerns over a recession in the future. Later today, investors will get the opportunity to react to a slew of U.S. economic reports. They include Core PCE, Personal Spending, Personal Income, Chicago PMI and Revised University of Michigan Consumer Sentiment.
At 06:48 GMT, June E-mini Dow Jones Industrial Average futures are trading 25795, up 58 or +0.23%.
Daily Swing Chart Technical Analysis
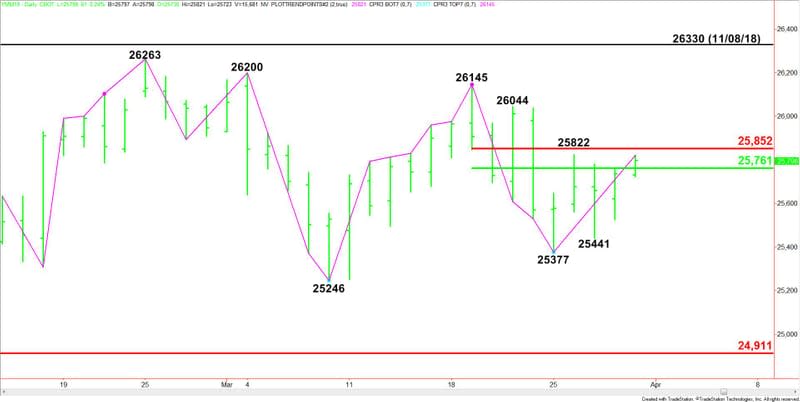
The main trend is down according to the daily swing chart. However, momentum is getting close to shifting to the upside. A trade through 26145 will negate a closing price reversal top and signal a resumption of the uptrend. A trade through 25377 will signal a resumption of the downtrend.
The minor trend is also down. A trade through 25822 will change the minor trend to up. This will also shift momentum to the upside.
The short-term range is 26145 to 25377. Its retracement zone at 25761 to 25852 is currently being tested. Trader reaction to this zone will determine the near-term direction of the Dow.
Bullish traders are going to try to take out the upper or Fibonacci level of this zone at 25852 in an effort to increase the upside momentum. Bearish traders are going to try to stop the counter-trend rally and drive the market through the lower or 50% level at 25761.
Daily Swing Chart Technical Forecast
Based on the early price action and the current price at 25761, the direction of the June E-mini Dow Jones Industrial Average futures contract is likely to be determined by trader reaction to the 50% level at 25761.
Bullish Scenario
A sustained move over 25761 will indicate the presence of buyers. This could trigger a rally into the Fib level at 25852. Look for sellers on the first test of this level. However, it is also the trigger point for an acceleration to the upside with the next target a minor top at 26044, followed by the main top at 26145.
Bearish Scenario
A sustained move under 25761 will signal the presence of sellers. If this move creates enough downside momentum then look for a potential break into a short-term pivot at 25599. This is followed by the minor bottom at 25441 and the main bottom at 25377.
This article was originally posted on FX Empire

