This is Donald Trump's favorite trade chart

President Donald Trump remains set on getting the U.S. what he thinks are better trade deals.
But many economists and investors disagree with Trump’s approach to trade and believe imposing tariffs on imports will directly result in what are effectively taxes on U.S. consumers as a result of higher prices.
In a tweet on Thursday, however, Trump said, “Billions of Dollars are pouring into the coffers of the U.S.A. because of the Tariffs being charged to China, and there is a long way to go. If companies don’t want to pay Tariffs, build in the U.S.A. Otherwise, lets just make our Country richer than ever before!”
As tends to be the case with almost everything Trump says, he is a little bit right and a little bit wrong. Tariffs imposed on imports from China make the price of those goods more expensive, which hurts consumers. Taxes paid to the U.S. Treasury from tariffs, however, are clearly rising.
The following chart was flagged for us by Neil Dutta at Renaissance Macro and shows the sharp uptick in government tax receipts from customs duties. In other words, tariffs.
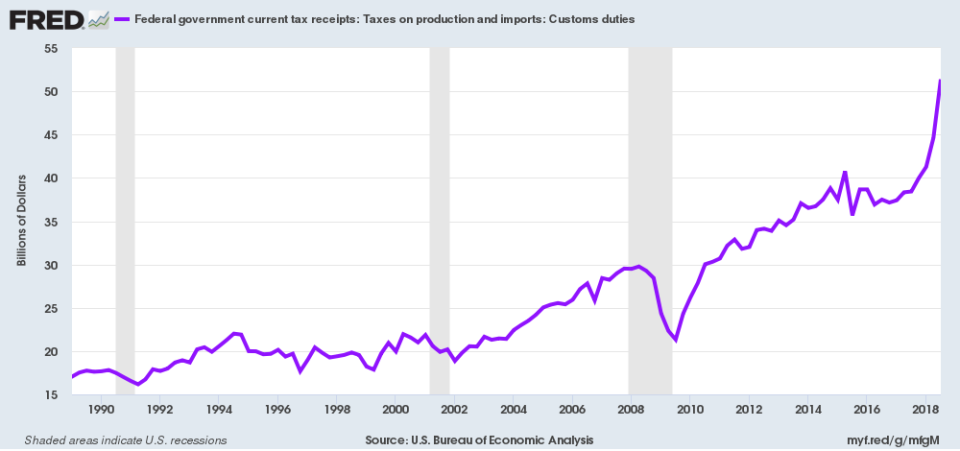
In July, the Trump administration put tariffs on $34 billion worth of imports from China; in September, the administration added a 10% tariff on the import of $200 billion in additional imports, a figure set to rise to 25% at the beginning of 2019.
In the third quarter of 2018, over $51 billion in taxes were paid to the Treasury as a result of duties imposed on imports, up from about $38 billion in the same quarter last year. Through the first three quarters of 2018, more than $136 billion in taxes were paid to the Treasury from these duties. In all of 2017, these duties totaled around $153 billion.
And while this impact isn’t massive in an absolute sense, the current run-rate for tariff-related taxes is about $200 billion per year, which would be a roughly 30% increase over the payments the Treasury had previously been receiving.
When some economists or analysts talk about the potentially minimal impacts that tariffs might have on GDP, it is this higher government income that could offset a decline in consumption due to higher prices. And this chart clearly shows the “billions of dollars [that] are pouring into the coffers” of the U.S. government. As Dutta notes, more tax income offsetting higher prices is how tariffs could manage to avoid being a major drag in the aggregate.
“I’m not saying I like it, but context is key,” Dutta writes.
And so ahead of this weekend’s G-20 summit which some investors might see as a potential turning point for markets and a thawing of trade relations between the U.S. and China, keep this chart in mind because when Trump continues to insist that the U.S. is winning on trade, this is the sort of data he’s likely pointing to.
—
Myles Udland is a writer at Yahoo Finance. Follow him on Twitter @MylesUdland

