Does Sensient Technologies Corporation's (NYSE:SXT) P/E Ratio Signal A Buying Opportunity?

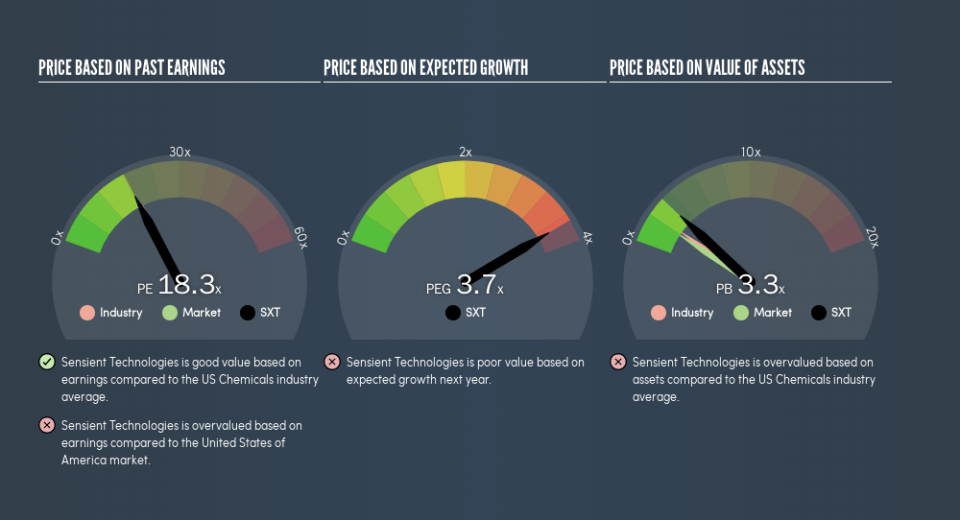
Today, we'll introduce the concept of the P/E ratio for those who are learning about investing. We'll show how you can use Sensient Technologies Corporation's (NYSE:SXT) P/E ratio to inform your assessment of the investment opportunity. Sensient Technologies has a P/E ratio of 18.25, based on the last twelve months. In other words, at today's prices, investors are paying $18.25 for every $1 in prior year profit.
See our latest analysis for Sensient Technologies
How Do You Calculate A P/E Ratio?
The formula for P/E is:
Price to Earnings Ratio = Price per Share ÷ Earnings per Share (EPS)
Or for Sensient Technologies:
P/E of 18.25 = $67.74 ÷ $3.71 (Based on the trailing twelve months to December 2018.)
Is A High Price-to-Earnings Ratio Good?
A higher P/E ratio implies that investors pay a higher price for the earning power of the business. That isn't necessarily good or bad, but a high P/E implies relatively high expectations of what a company can achieve in the future.
How Growth Rates Impact P/E Ratios
Generally speaking the rate of earnings growth has a profound impact on a company's P/E multiple. Earnings growth means that in the future the 'E' will be higher. Therefore, even if you pay a high multiple of earnings now, that multiple will become lower in the future. Then, a lower P/E should attract more buyers, pushing the share price up.
Sensient Technologies's 81% EPS improvement over the last year was like bamboo growth after rain; rapid and impressive. And earnings per share have improved by 17% annually, over the last three years. So we'd absolutely expect it to have a relatively high P/E ratio.
Does Sensient Technologies Have A Relatively High Or Low P/E For Its Industry?
The P/E ratio indicates whether the market has higher or lower expectations of a company. As you can see below Sensient Technologies has a P/E ratio that is fairly close for the average for the chemicals industry, which is 18.4.
Sensient Technologies's P/E tells us that market participants think its prospects are roughly in line with its industry. If the company has better than average prospects, then the market might be underestimating it. Further research into factors such asmanagement tenure, could help you form your own view on whether that is likely.
Don't Forget: The P/E Does Not Account For Debt or Bank Deposits
The 'Price' in P/E reflects the market capitalization of the company. Thus, the metric does not reflect cash or debt held by the company. The exact same company would hypothetically deserve a higher P/E ratio if it had a strong balance sheet, than if it had a weak one with lots of debt, because a cashed up company can spend on growth.
Spending on growth might be good or bad a few years later, but the point is that the P/E ratio does not account for the option (or lack thereof).
Is Debt Impacting Sensient Technologies's P/E?
Sensient Technologies's net debt is 24% of its market cap. That's enough debt to impact the P/E ratio a little; so keep it in mind if you're comparing it to companies without debt.
The Verdict On Sensient Technologies's P/E Ratio
Sensient Technologies's P/E is 18.3 which is about average (17.9) in the US market. When you consider the impressive EPS growth last year (along with some debt), it seems the market has questions about whether rapid EPS growth will be sustained.
Investors should be looking to buy stocks that the market is wrong about. As value investor Benjamin Graham famously said, 'In the short run, the market is a voting machine but in the long run, it is a weighing machine.' So this free report on the analyst consensus forecasts could help you make a master move on this stock.
You might be able to find a better buy than Sensient Technologies. If you want a selection of possible winners, check out this free list of interesting companies that trade on a P/E below 20 (but have proven they can grow earnings).
We aim to bring you long-term focused research analysis driven by fundamental data. Note that our analysis may not factor in the latest price-sensitive company announcements or qualitative material.
If you spot an error that warrants correction, please contact the editor at editorial-team@simplywallst.com. This article by Simply Wall St is general in nature. It does not constitute a recommendation to buy or sell any stock, and does not take account of your objectives, or your financial situation. Simply Wall St has no position in the stocks mentioned. Thank you for reading.
