Does Samuel Heath & Sons PLC’s (LON:HSM) P/E Ratio Signal A Buying Opportunity?

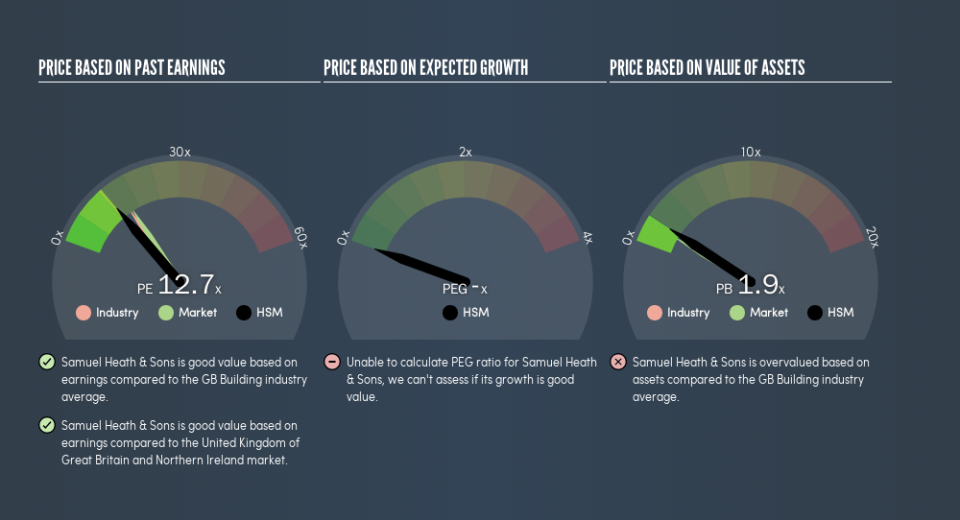
The goal of this article is to teach you how to use price to earnings ratios (P/E ratios). To keep it practical, we’ll show how Samuel Heath & Sons PLC’s (LON:HSM) P/E ratio could help you assess the value on offer. Samuel Heath & Sons has a P/E ratio of 12.74, based on the last twelve months. That corresponds to an earnings yield of approximately 7.8%.
Check out our latest analysis for Samuel Heath & Sons
How Do You Calculate A P/E Ratio?
The formula for P/E is:
Price to Earnings Ratio = Share Price ÷ Earnings per Share (EPS)
Or for Samuel Heath & Sons:
P/E of 12.74 = £3.7 ÷ £0.29 (Based on the trailing twelve months to September 2018.)
Is A High P/E Ratio Good?
A higher P/E ratio means that buyers have to pay a higher price for each £1 the company has earned over the last year. All else being equal, it’s better to pay a low price — but as Warren Buffett said, ‘It’s far better to buy a wonderful company at a fair price than a fair company at a wonderful price.’
How Growth Rates Impact P/E Ratios
Earnings growth rates have a big influence on P/E ratios. Earnings growth means that in the future the ‘E’ will be higher. That means even if the current P/E is high, it will reduce over time if the share price stays flat. So while a stock may look expensive based on past earnings, it could be cheap based on future earnings.
Samuel Heath & Sons saw earnings per share decrease by 26% last year. But over the longer term (5 years) earnings per share have increased by 18%.
How Does Samuel Heath & Sons’s P/E Ratio Compare To Its Peers?
The P/E ratio indicates whether the market has higher or lower expectations of a company. If you look at the image below, you can see Samuel Heath & Sons has a lower P/E than the average (15.3) in the building industry classification.
Samuel Heath & Sons’s P/E tells us that market participants think it will not fare as well as its peers in the same industry. Many investors like to buy stocks when the market is pessimistic about their prospects. You should delve deeper. I like to check if company insiders have been buying or selling.
Don’t Forget: The P/E Does Not Account For Debt or Bank Deposits
The ‘Price’ in P/E reflects the market capitalization of the company. Thus, the metric does not reflect cash or debt held by the company. Hypothetically, a company could reduce its future P/E ratio by spending its cash (or taking on debt) to achieve higher earnings.
Such expenditure might be good or bad, in the long term, but the point here is that the balance sheet is not reflected by this ratio.
Is Debt Impacting Samuel Heath & Sons’s P/E?
The extra options and safety that comes with Samuel Heath & Sons’s UK£2.8m net cash position means that it deserves a higher P/E than it would if it had a lot of net debt.
The Verdict On Samuel Heath & Sons’s P/E Ratio
Samuel Heath & Sons has a P/E of 12.7. That’s below the average in the GB market, which is 15.8. The recent drop in earnings per share would make investors cautious, the healthy balance sheet means the company retains potential for future growth. If that occurs, the current low P/E could prove to be temporary.
Investors have an opportunity when market expectations about a stock are wrong. If the reality for a company is not as bad as the P/E ratio indicates, then the share price should increase as the market realizes this. Although we don’t have analyst forecasts, you might want to assess this data-rich visualization of earnings, revenue and cash flow.
Of course, you might find a fantastic investment by looking at a few good candidates. So take a peek at this free list of companies with modest (or no) debt, trading on a P/E below 20.
We aim to bring you long-term focused research analysis driven by fundamental data. Note that our analysis may not factor in the latest price-sensitive company announcements or qualitative material.
If you spot an error that warrants correction, please contact the editor at editorial-team@simplywallst.com. This article by Simply Wall St is general in nature. It does not constitute a recommendation to buy or sell any stock, and does not take account of your objectives, or your financial situation. Simply Wall St has no position in the stocks mentioned. Thank you for reading.

