Crude Oil Price Update – Needs to Hold $44.68 Pivot to Generate Any Upside Momentum
U.S. West Texas Intermediate crude oil futures settled higher on Friday, getting most of its help from firm U.S. equity markets. End-of-the-month position squaring may have also helped to hold the market inside the previous day’s range.
The U.S. Energy Information Administration’s (EIA) weekly inventories report failed to generate much reaction. It showed that U.S. crude oil inventories declined by 46,000 barrels during the week-ending December 21, versus a forecast of a drop of 2.9 million barrels.
On Friday, February WTI crude oil settled at $45.33, up $0.72 or -1.59%.
Daily Swing Chart Technical Analysis
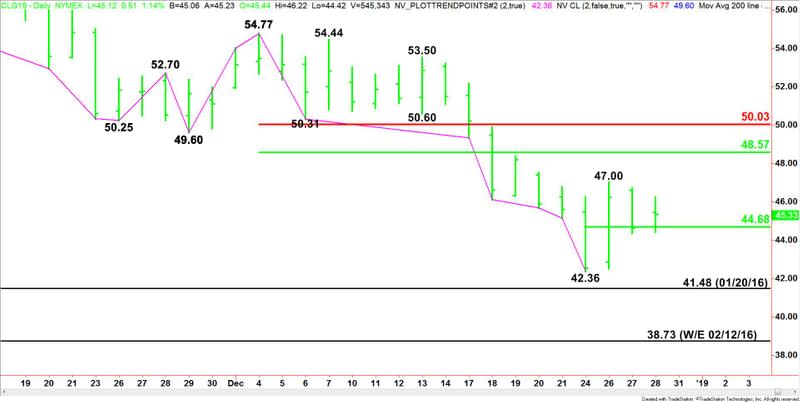
The main trend is down according to the daily swing chart. A trade through $42.36 will signal a resumption of the uptrend. The main trend will change to up on a trade through $54.77.
Last week, the selling stopped at $42.36. A major reversal in the stock market then drove the market to $47.00. This is our short-term range. The mid-point or 50% level of this range is $44.68. This level provided support on Thursday and Friday last week. It appears to be controlling the short-term direction of the market.
The main range is $54.77 to $42.36. Its retracement zone at $48.57 to $50.03 is the primary upside target.
Daily Swing Chart Technical Forecast
Based on last week’s price action and Friday’s close at $45.33, the direction of the February WTI crude oil market on Monday is likely to be determined by trader reaction to the short-term pivot at $44.68.
Bullish Scenario
A sustained move over $44.68 will indicate the presence of buyers. If this can generate enough upside action then look for a possible drive into the retracement zone at $48.57 to $50.03.
Bearish Scenario
A sustained move under $44.68 will signal the presence of sellers. The daily chart is wide open under this level with the next target price last week’s low at $42.36.
If $42.36 fails then look for a test of the January 20, 2016 main bottom at $41.48. Look out to the downside if this price level fails as support. The nearest target under this price is the February 12, 2016 main bottom at $38.73.
This article was originally posted on FX Empire
More From FXEMPIRE:
Crude Oil Price Update – Direction into Close Will Be Determined by Trader Reaction to $44.68 Pivot
Gold Futures Shine, but EIA Reports Fail to Help Crude Oil, Natural Gas
AUD/USD Forex Technical Analysis – Daily Chart Strengthens Over .7078, Weakens Under .7016
Dollar Dives as Investors Take Protection in Yen, Swiss Franc
USD/JPY Forex Technical Analysis – Closed on Bearish Side of 110.584 to 111.347 Retracement Zone

