Brent Crude Oil Price Update – Traders Respecting 200-Day Moving Average at $68.96
International-benchmark Brent crude oil futures settled slightly higher on Friday as tightened global supplies and expectations of rising U.S. refining demand offset U.S.-China trade tensions. The futures contract still settled lower for the week with worries that a protracted trade dispute would eventually lead to a U.S. recession and lower future demand.
On Friday, July Brent crude oil futures settled at $70.62, up $0.23 or +0.33%.
Daily Swing Chart Technical Analysis
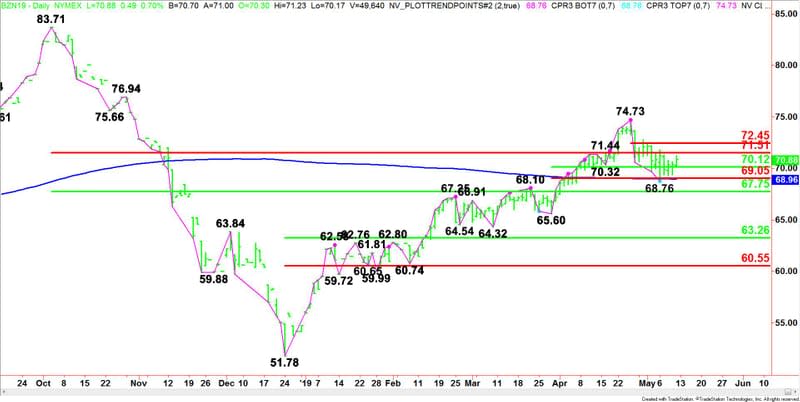
The main trend is down according to the daily swing chart. However, momentum may be getting ready to shift to the upside with the formation of the closing price reversal bottom at $68.76 on May 6.
A trade through $71.79 will confirm the closing price reversal bottom. This will shift momentum to the upside. If the market can claw through three retracement levels then we could see a test of the main top at $74.73.
A trade through $74.73 will negate a closing price reversal top and change the main trend to up. A move through $68.76 will negate the closing price reversal bottom and signal a resumption of the downtrend. This could lead to an eventual test of the next main bottom at $65.60.
The major range is $83.71 to $51.78. The market is currently trading inside its retracement zone at $67.75 to $71.51. This zone is controlling the longer-term direction of the market.
The main range is $65.60 to $74.73. Its retracement zone at $70.12 to $69.05 is also support. It falls inside the major retracement zone.
The short-term range is $74.73 to $68.76. Its retracement zone at $71.75 to $72.45 is the next potential upside target. Since the main trend is down, sellers could come in on a test of this zone. They are going to try to form a secondary lower top.
Last week’s price action also showed that traders are respecting the 200-day moving average, currently at $68.96. This price is very important support.

Daily Swing Chart Technical Forecast
With the main trend down, trader reaction to the major Fibonacci level at $71.51 will determine the direction of the July Brent crude oil market on Monday.
Bearish Scenario
A sustained move under $71.51 will indicate the presence of sellers. Taking out the short-term 50% level at $70.12 will indicate the selling is getting stronger. This could lead to a test of the short-term Fibonacci level at $69.05 and the 200-day moving average at $68.96.
If $69.96 fails as support then look for a test of the closing price reversal bottom at $68.76. If this price fails then look for a break into the major 50% level at $67.75. This is the trigger point for a potential acceleration to the downside with $65.60 the next likely downside target.
Bullish Scenario
A sustained move over $71.51 will signal the presence of buyers. This could lead to a test of the short-term retracement zone at $71.75 to $72.45.
If taking out $72.45 creates enough upside momentum then look for the buying to eventually extend into the main top at $74.73.
Short-term, keep an eye on the 200-day moving average at $68.96. Long-term, watch the major 50% level at $67.75 for a breakout to the downside and the major 61.8% at $71.51 for a breakout to the upside.
This article was originally posted on FX Empire
More From FXEMPIRE:
Bitcoin Cash – ABC, Litecoin and Ripple Daily Analysis – 12/05/19
NZD/USD Forex Technical Analysis – With Trend Down, Sellers Could Return on Test of .6609 to .6627
Forex Daily Recap – Poor CPI Data Pushed Down the Greenback Near 97.14 Weekly Low Levels
U.S Mortgages – Down Again as Trade War Jitters Test Risk Sentiment

