Brent Crude Oil Price Update – Needs to Hold $71.77 to Stabilize Market
International-bench mark Brent crude oil futures finished sharply lower on Friday after President Trump said he told OPEC to take action to bring down fuel costs. The news encouraged traders who bought earlier in the week to take profits. Brent crude oil prices surged more than 3% at the start of the week after the Trump administration said it will not extend waivers that allow several countries to continue buying Iranian crude despite U.S. sanctions on the rogue nation.
On Friday, June Brent crude oil futures settled at $72.15, down $2.20 or -3.05%.
Traders should expect heightened volatility since it is unclear whether Trump actually spoke with OPEC leaders. The Wall Street Journal reported that OPEC’s Secretary General Mohammed Barkindo has not spoken to Trump, citing a source. Saudi officials also told the Journal that Trump has not discussed lowering prices with them.
Daily Technical Analysis
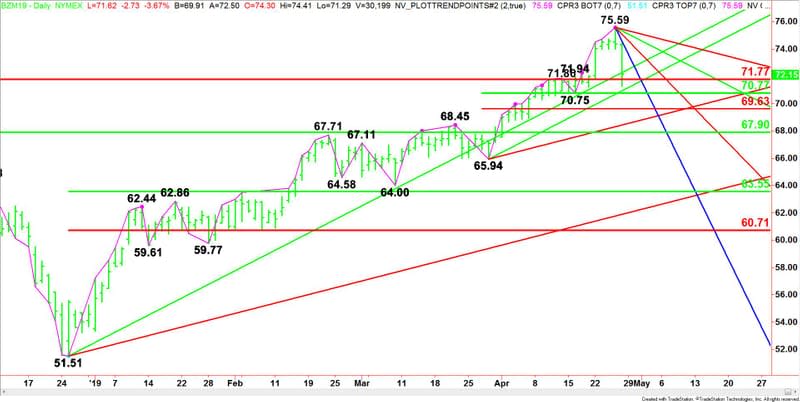
The main trend is up according to the daily swing chart, however, momentum shifted to the downside on Thursday with the formation of a closing price reversal top and its subsequent confirmation on Friday.
The main trend will change to down according to the daily swing chart on a trade through $70.75. A move through $75.59 will negate the closing price reversal top and signal a resumption of the uptrend.
The major retracement zone at $71.77 to $67.90 is controlling the longer-term direction of the Brent crude oil market.
The short-term range is $65.94 to $75.59. Its retracement zone at $70.77 to $69.63 falls inside the major retracement zone.
Daily Technical Forecast
Based on Friday’s price action and the close at $72.15, the direction of the June Brent crude oil futures contract is likely to be determined by trader reaction to the major Fibonacci level at $71.77.
Bullish Scenario
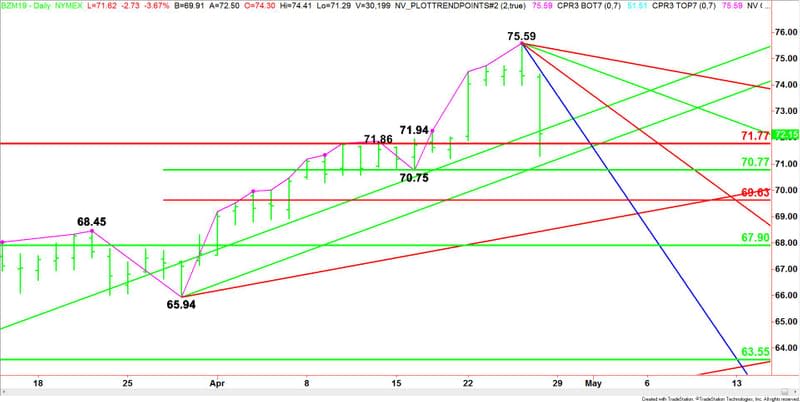
A sustained move over $71.77 will indicate the presence of buyers. Overtaking the longer-term uptrending Gann angle at $72.51 will indicate the presence of buyers. This could create the upside momentum needed to challenge the first downtrending Gann angle at $73.59. This is followed by downtrending Gann angles at $74.59 and $75.09. The latter is the last major downtrending Gann angle before the $75.59 main top.
Bearish Scenario
A sustained move under $71.77 will signal the presence of sellers. This could trigger a labored break into an uptrending Gann angle at $71.19, followed by a short-term 50% level at $70.77 and a main bottom at $70.75. The most important area is the support cluster at $70.77 to $70.75.
If $70.75 fails and the trend changes to down then look for a potential acceleration into the short-term Fibonacci level at $69.63. This is followed by a short-term uptrending Gann angle at $68.57 and the major 50% level at $67.90.
This article was originally posted on FX Empire

