Booz Allen (BAH) Beats Q4 Earnings and Revenue Estimates
Booz Allen Hamilton Holding Corporation BAH reported strong fourth-quarter fiscal 2019 results, beating the Zacks Consensus Estimate on both earnings and revenues.
Adjusted EPS of 64 cents beat the consensus mark by 2 cents and improved on a year-over-year basis. The bottom line benefited from top-line growth, strong contract level performance and operational management.
Total revenues of $1.8 billion surpassed the Zacks Consensus Estimate by roughly $73 million and increased year over year. The top line benefited from continued boost in client demand and increase in headcount.
Revenues excluding billable expenses were $1.2 billion, up 8.1% on a year-over-year basis. Billable expenses accounted for 30.3% of revenues. Booz Allen earns the maximum amount of profit from revenues, excluding billable expenses.
Booz Allen Hamilton Holding Corporation Price and Consensus
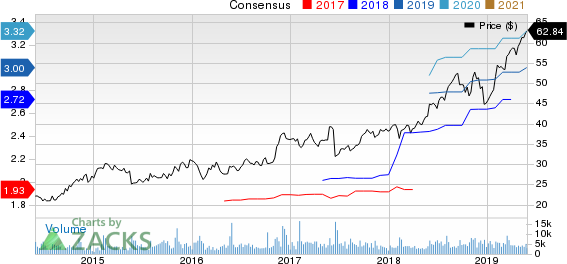
Booz Allen Hamilton Holding Corporation price-consensus-chart | Booz Allen Hamilton Holding Corporation Quote
Total backlog increased 20.6% from the prior-year quarter to $19.3 billion. While funded backlog of $3.4 billion improved 28%, unfunded backlog was down 11.4% to $3.7 billion. Priced options went up 33% to $12.2 billion. Book-to-bill ratio was 0.36, down 40% year over year.
Headcount of 26,069 increased 5.8% year over year. Strong hiring and retention during the quarter enabled the company to surpass its headcount growth target of 5% for the fiscal year.
Booz Allen updated its three-year adjusted EPS goal. For the period from fiscal 2018 through fiscal 2021, the company now targets adjusted EPS growth of 66% compared with the previous target of 50%. It expects dividend yield of approximately 2%, supported by 6%-9% annual revenue growth, low 10% range adjusted EBITDA margin and $1.4 billion in capital deployment.
Shares of Booz Allen have gained a massive 38.4% year to date, significantly outperforming 25.7% growth of the industry it belongs to.

Operating Results
Adjusted EBITDA of $153.3 million increased 3.4% year over year. Adjusted EBITDA margin on revenues declined to 8.6% from 9.1% in the year-ago quarter. Adjusted EBITDA margin on revenues, excluding billable expenses declined to 12.4% from 12.9% in the year-ago quarter.
Adjusted operating income was $135.1 million, up 2.6% year over year. Adjusted operating income margin on revenues was 7.6% compared with 8.1% in the year-ago quarter. Adjusted operating income margin on revenues, excluding billable expenses was 10.9% compared with 11.5% in the year-ago quarter.
Balance Sheet & Cash Flow
Booz Allen exited the fiscal fourth quarter with cash and cash equivalents of $284 million compared with $211.9 million at the end of the prior quarter. Long-term debt (net of current portion) was $1.7 billion, roughly flat with the previous quarter figure.
The company generated $216.4 million of net cash from operating activities. Capital expenditure was $36.6 million and free cash flow was $179.8 million.
The company declared quarterly dividend of 23 cents per share, payable on Jun 28, 2019, to stockholders of record on Jun 14, 2019. It paid dividends worth $32.4 million and repurchased shares worth $71.4 million in the reported quarter.
Fiscal 2020 Outlook
Management expects adjusted EPS to range between $2.90 and $3.05, the mid-point of which ($2.98) is slightly above the Zacks Consensus Estimate of $2.96 for the period.
The company expects revenue growth of 6-9%. Adjusted EBITDA margin on revenues is anticipated in the low 10% range.
The company targets another 5% headcount growth for the fiscal year as labor market stays tight.
Zacks Rank & Other Key Picks
Booz Allen currently carries a Zacks Rank #2 (Buy). You can see the complete list of today’s Zacks #1 Rank (Strong Buy) stocks here.
Some other top-ranked stocks in the broader Zacks Business Services sector are Navigant Consulting NCI, WEX WEX and FLEETCOR Technologies FLT. While Navigant Consulting sports a Zacks Rank #1, WEX and FLEETCOR carry a Zacks Rank #2.
Long-term expected EPS (three to five years) growth rate for Navigant Consulting, WEX and FLEETCOR is 13.5%, 15% and 16.5%, respectively.
Will you retire a millionaire?
One out of every six people retires a multimillionaire. Get smart tips you can do today to become one of them in a new Special Report, “7 Things You Can Do Now to Retire a Multimillionaire.”
Click to get it free >>
Want the latest recommendations from Zacks Investment Research? Today, you can download 7 Best Stocks for the Next 30 Days. Click to get this free report
FleetCor Technologies, Inc. (FLT) : Free Stock Analysis Report
WEX Inc. (WEX) : Free Stock Analysis Report
Navigant Consulting, Inc. (NCI) : Free Stock Analysis Report
Booz Allen Hamilton Holding Corporation (BAH) : Free Stock Analysis Report
To read this article on Zacks.com click here.
Zacks Investment Research
