AUD/USD Forex Technical Analysis – Price Action Being Controlled by Series of Retracement Levels
The Australian Dollar posted a two-side trade before closing lower on Friday. The price action was fueled by a mixed reaction to the U.S. Non-Farm Payrolls report.
The headline number grabbed the attention of traders initially, but conditions settled almost immediately after traders saw the wage data. Non-farm payrolls rose by 196,000 jobs, beating the 172,000 jobs estimate. Furthermore, last month’s dismal 20,000 jobs gain was raised slightly to 33,000. The unemployment rate came in at 3.8 percent, matching February’s numbers and the estimate.
Wage gains for March were disappointing, showing average hour earnings increased by only four cents, or 0.1 percent after climbing 0.4 percent in February.
Despite the mixed U.S. jobs report, the Aussie felt pressure from traders betting on a rate cut by the Reserve Bank of Australia (RBA) later in the year.
On Friday, the AUD/USD settled at .7105, down -0.0009 or -0.13%.
Daily Swing Chart Technical Analysis
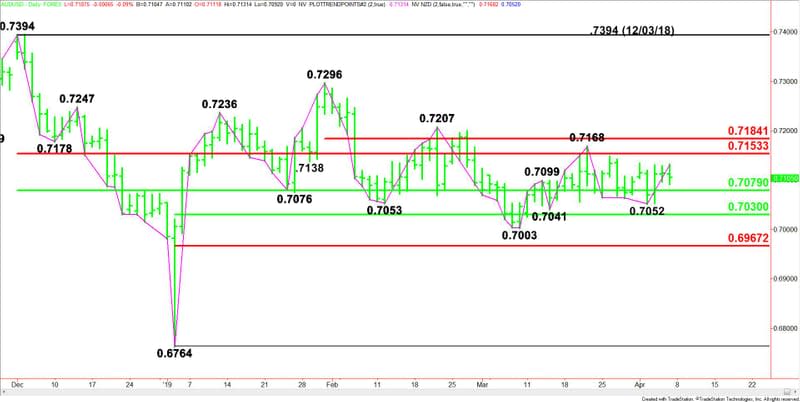
The main trend is up according to the daily swing chart. However, it’s difficult to tell because looking at the chart from early December suggests a sideways-to-lower trade.
A move through .7052 will change the main trend to down. A trade through .7168 will reaffirm the uptrend.
Most of the price action lately has been dictated by trader reaction to three retracement zones.
The main range is .7394 to .6764. Its retracement zone is .7079 to .7153. The AUD/USD closed inside this zone on Friday. It is controlling the longer-term direction of the Forex pair.
The intermediate-term range is .6764 to .7296. Its retracement zone at .7030 to .6967 is providing support.
The short-term range is .7296 to .7003. Its retracement zone at .7150 to .7184 is resistance.
Combining the retracement zones indicates the key area to watch is a resistance cluster at .7150 to .7153. This area is essentially controlling the longer-term direction of the AUD/USD.
Daily Swing Chart Technical Forecast
Friday’s close fell inside a 50% level at .7079 and a resistance zone at .7150 to .7153. Trader reaction to these levels will set the tone for the week. Trading inside .7079 to .7153 will indicate a neutral market.
Bullish Scenario
In order to generate a strong upside bias, buyers are going to have to overcome .7153, .7168, .7184 and .7207 in succession.
Bearish Scenario
Selling pressure is likely to increase if .7079 fails as support. However, sellers will still have to take out .7052, .7041 and .7030 in order to trigger an acceleration to the downside.
The AUD/USD is likely to continue to trade rangebound until the RBA changes policy and indicates its next move will likely be a rate cut. At least that’s what the bearish traders are betting on.
This article was originally posted on FX Empire
More From FXEMPIRE:
Forex Daily Recap – The Greenback Accumulates More Power Despite US Mixed Job Reports
AUD/USD Forex Technical Analysis – Price Action Being Controlled by Series of Retracement Levels
Bitcoin Cash – ABC, Litecoin and Ripple Daily Analysis – 07/04/19
Bitcoin Cash – ABC, Litecoin and Ripple Daily Analysis – 06/04/19
EUR/USD Forex Technical Analysis – Investors Vigorously Defending Major Fibonacci Level at 1.1185

