AUD/USD Forex Technical Analysis – January 3, 2019 Forecast
The Australian Dollar was a victim of the “flash crash” earlier in the session. The move drove it to multi-year lows, but we’re not sure how much was actually traded at the lows. In the meantime, the currency has clawed back nearly all of its earlier losses. It may take a couple of days to sort out the matter.
At 0829 GMT, the AUD/USD is trading .6973, down 0.0012 or -0.20%.
Daily Swing Chart Technical Analysis
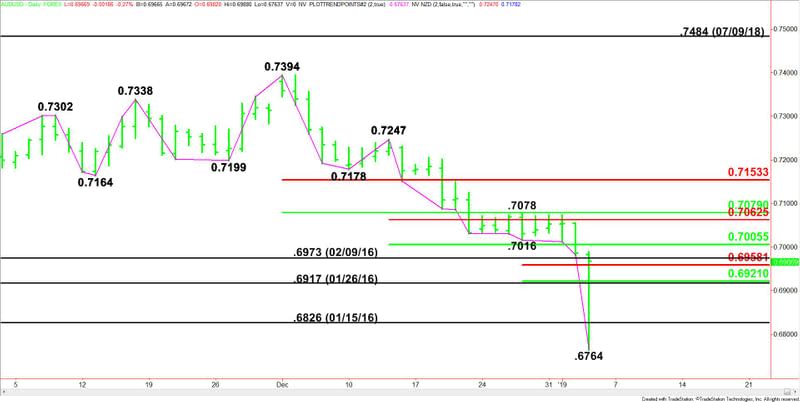
The main trend is down according to the daily swing chart. A trade through .7247 will change the main trend to up. A closing price reversal bottom today will indicate the buying is greater than the selling at current price levels. This won’t change the trend to up, but it could fuel a 2 to 3 day counter-trend rally.
The minor trend is also down. A move through .7078 will change the minor trend to up. This will shift momentum to the upside.
Assuming today’s intraday low at .6764 is valid, the new minor range is .7078 to .6764. Its retracement zone at .6921 to .6958 is currently being straddled. Trading on the strong side of this zone will indicate the return of buyers.
The intermediate range is .7247 to .6764. Its retracement zone at .7006 to .7063 is the next upside target.
The main range is .7394 to .6764. Its retracement zone at .7079 to .7153 is the primary upside target.
Combining the intermediate and main retracement zones creates a resistance cluster at .7063 to .7079. Since the main trend is down, sellers could come in on a test of this area.
Daily Swing Chart Technical Forecast
Based on the current price at .6969, the direction of the AUD/USD the rest of the session is likely to be determined by trader reaction to yesterday’s close at .6986.
Bullish Scenario
Overcoming and sustaining a move over .6986 will indicate the presence of buyers. This will also put the AUD/USD in a position to form a potentially bullish closing price reversal bottom. If formed and confirmed on Friday, this chart pattern can lead to a 2 to 3 day counter-trend rally.
Bearish Scenario
A sustained move under .6986 will signal the presence of sellers. This could lead to a pullback into the short-term 50% to 61.8% retracement zone at .6958 to .6921.
It may take a few days to stabilize the market and re-establish support and resistance levels.
This article was originally posted on FX Empire

