AUD/USD Forex Technical Analysis – March 8, 2019 Forecast
The Australian Dollar is trading slightly lower early Friday. Traders are showing little reaction to China’s worse than expected trade data for the month of February, while tightening up positions ahead of today’s February U.S. Non-Farm Payrolls report.
Data from China showed February dollar-denominated exports fell 20.7 percent, compared to an expected 4.8 percent fall. February dollar-denominated imports fell 5.2 percent, compared to an expected 1.4 percent fall. Additionally, China’s overall trade surplus for the month came to $4.12 billion – much weaker than an expected $26.38 billion.
At 13:30 GMT, the U.S. will release its latest report on Non-Farm Employment Change, Unemployment Rate and Average Hourly Earnings. Bullish numbers could further sink the Australian Dollar.
At 06:13 GMT, the AUD/USD is trading .7008, down 0.0005 or -0.08%.
Daily Technical Analysis
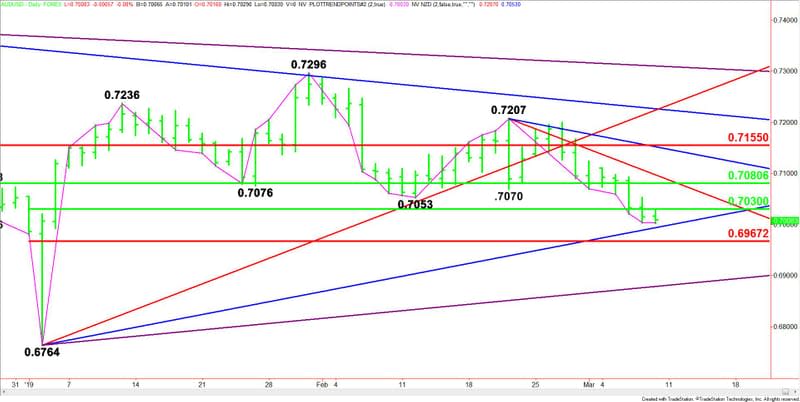
The main trend is down according to the daily swing chart. The nearest main bottom is .6764 from January 3. The main trend will change to up on a move through .7207. The Aussie isn’t close changing the main trend to up, but it is in the window of time for a closing price reversal bottom.
The main range is .6764 to .7296. The Aussie is currently testing its retracement zone at .7030 to .6967. This zone is controlling the near-term direction of the Forex pair.
On the upside, the main resistance is a retracement zone at .7081 to .71550.
Daily Technical Forecast
Based on the early price action, the direction of the AUD/USD is likely to be determined by trader reaction to the 50% level at .7030.
Bullish Scenario
A sustained move over .7030 will indicate the presence of buyers. If this move can create enough upside momentum then look for a move into the main 50% level at .7081, followed closely by a downtrending Gann angle at .7097. Since the main trend is down, sellers are likely to come in on a test of this Gann angle.
Bearish Scenario
A sustained move under .7030 will signal the presence of sellers. This could lead to a test of an uptrending Gann angle at .6994. If this angle fails then look for the selling to extend into the Fibonacci level at .6967. This level is a potential trigger point for an acceleration to the downside with the next target angle coming in at .6879. This is the last potential support angle before the .6764 main bottom.
This article was originally posted on FX Empire
More From FXEMPIRE:
Cardano’s ADA Technical Analysis – Support Levels in Play – 08/03/19
EUR/USD Price Forecast – EUR/USD To Continue Range Bound Action Below Mid -1.12 Handle
Bitcoin Cash – ABC, Litecoin and Ripple Daily Analysis – 08/03/19
EUR/USD Forex Technical Analysis – Testing Lower End of Weekly Retracement Zone
DAX Index Daily Price Forecast – Dovish ECB Update To Pressure German Equities Into Bear’s Territory
