5 Top Dividend Stocks to Buy Now
There's no shortage of stock selection criteria that investors can use in pursuit of market-beating returns, but no strategy has more reliably created wealth than buying quality dividend stocks, setting the payments to reinvest, and holding for the long term.
Whether an investor is young or old, new to the market or a seasoned pro, income-generating stocks can play a key role in elevating portfolio performance and paving a path to financial freedom. Owning a collection of dividend stocks shouldn't be thought of as a way to generate great returns without work, research, or risk, but dividend investing does present a blueprint that the average investor can thrive with once he or she knows what to look for and has a solid foundation to build on.
Understanding the basics of dividends
When you buy a stock, you're purchasing an ownership stake in that business, and some companies will opt to distribute a portion of earnings to their shareholders in the form of cash dividends. Not every company chooses to pay a dividend -- with some instead preferring to reinvest cash flows into growing the business, pay down debts, or build capital reserves in accordance with their needs.
Depending on the state of the business and its growth needs, returning income to shareholders isn't always the best use of capital. Companies that are in relatively early growth stages tend to be better served by funneling profits back into expanding the business, but there are clear reasons many investors flock to income-generating stocks.

Image source: Getty Images.
Companies that are in a position to pay regular dividends tend to have dependable earnings, and this characteristic in conjunction with the power of compounding and reinvestment have led dividend stocks as a category to outperform their non-income-generating counterparts over the long term. That doesn't mean investors should just select dividend stocks at random and expect to beat the market, however.
How to analyze dividend stocks
Investors will want to look at characteristics including dividend yield and payout ratios, histories, and growth rates to narrow their search and identify the most promising income-generating investments.
Yield. Dividend yield is calculated by dividing a company's annual payout by its stock price, with a market-beating or industry-beating yield typically, but not always, being an appealing characteristic. If a stock costs $100 per share and pays $2 in dividends to shareholders over the course of a year, it has a 2% yield -- coming in just above the 1.9% average yield of stocks on the S&P 500 index.
However, a stock isn't necessarily a bad income investment just because its yield comes in below the market or industry average, and investors shouldn't rush to buy a stock simply because it offers big payouts. Dividend yield is an expression of how much income is expected to be generated over an annual period in relation to an initial investment, but it should be looked at in a broader context to assess how an investment might perform over the long term.
High yield can be a sign that a business is in trouble and having difficulty attracting investors. A company's stock price will usually decline if the business is becoming, or is expected to become, less profitable -- and a sinking share price has the effect of increasing a stock's yield. A 10%, 20%, or even 50% yield might look attractive on paper, but such high payouts often indicate that the underlying business isn't performing well -- which means that a dividend cut or suspension could be on the horizon. If a stock price plummets and dividend payments are reduced or suspended, investors might never recoup their initial investment. The dynamic of getting drawn into a stock that has a high yield but a troubled business is sometimes referred to as a yield trap.History of payout increases. Companies that regularly increase their payouts often do so on an annual basis, but some opt to increase their payouts more than once per year. Investors can get an idea of whether it's reasonable to expect continued dividend growth by looking at whether a company has consistently delivered payout increases.
After a company has built up a track record of dependable payout growth, investors will expect that tradition to continue -- and that expectation tends to have a positive effect on a company's stock price. On the other hand, a suspended dividend or lack of payout growth tends to negatively affect share price. There's no guarantee that a company with a 30-year history of annual payout increases will continue to expand its dividend, but a long streak of consecutive annual increases is a sign that a business has been strong enough to support payout growth. The possibility of steep stock declines also gives management some extra incentive to keep the growth streak alive.Rate of dividend growth. Dividend growth rate shows how much a company has increased its payout over a stretch of time. If a company raises its annual dividend from $1 to $2 over a five-year period, its rate of dividend growth across that five-year period is 100% -- or an average annual increase of roughly 14.9%. A company that doubles its payout over a five-year period is delivering rapid payout growth, but the importance of dividend growth rate varies depending on the stock's starting payout. If a stock already has a 4% or 5% yield, it's somewhat expected that it will have slower dividend growth, because its yield is already well above the market average. Conversely, income-focused investors will often look for fast dividend growth when buying stocks with lower starting yields -- operating with the expectation that shares will deliver much larger payouts in the not-too-distant future.
Earnings. Earnings are a business' profits over a given period and are typically reported on a quarterly basis. Profitability is calculated by taking a business' revenue over a period and subtracting the total costs to produce that revenue, along with money owed in taxes. Having a picture of how much a company's earnings are likely to increase or decrease helps to determine whether a business is healthy enough to support dividend payouts down the line. Companies that manage to consistently increase their earnings will tend to have rising stock prices, and increasing profits also puts those businesses in a better position to continue raising their dividend payouts.
Free cash flow. Free cash flow (FCF) is defined as operating cash flow minus capital expenditures. Operating cash flow is a business' net profit less non-cash expenses (such as stock-based compensation) and the change in working capital (defined as the difference between the company's assets and liabilities) since its last reporting period. Capital expenditures are funds used to acquire new physical assets and update and maintain assets such as buildings or equipment.
Dividends are typically paid from a company's FCF, so this metric can indicate whether the company will be able to sustain and build its returned-income component. Free cash flow can be a better metric than earnings for measuring whether a dividend is sustainable or for valuing a stock, because earnings can include one-time events such as write-offs or tax bonuses.Payout ratios. To assess whether a company is in a position to sustain and grow its dividend, it helps to look at the annual payout in relation to the business' earnings and free cash flow. Dividing a company's annual dividend distribution by its earnings or FCF across the past fiscal year or four reported quarters shows what percentage of its cash generation is being used to cover the dividend.
High payout ratios can indicate that a company will have difficulty sustaining or growing its dividend. A payout ratio of 100% means a company is using all of its earnings or free cash flow to fund its dividend distribution, leaving no money from operations to put back into the business. Investors should look for dividend stocks with manageable payout ratios, because this suggests that the underlying businesses are generating enough cash to make payouts to shareholders while also reinvesting in the business and paying down debts.
What constitutes a good payout ratio varies depending on the individual company and its industry. An 80% payout ratio is generally considered high, but it might not be a warning sign for a company that's already well established in its market and doesn't have to reinvest as much of its cash to expand sales and earnings. Conversely, a 25% payout ratio is relatively low and suggests a company should have no trouble covering its dividend, but it might be too high for a young technology company that could put the money to better use by reinvesting in the business.
Payout ratios can also be calculated using projected earnings and FCF or expected dividend growth. Using targets based on company guidance, analyst estimates, and historical or projected dividend growth rates gives investors an idea of what payout ratios will look like if a company's cash generation and dividend change. If a company isn't generating enough cash to cover its dividend payments, it will have to pay from its cash pile or take out loans to make its distribution. Dipping into cash assets or using loans to cover dividend payouts for a short period isn't necessarily a disaster scenario, but it's not sustainable over the long term, because eventually there won't be assets to pay dividends from.
Using this analysis criteria, I've identified Realty Income Corporation (NYSE: O), Apple (NASDAQ: AAPL), AT&T (NYSE: T), The Walt Disney Company (NYSE: DIS), and International Business Machines (NYSE: IBM) as top stocks for investors looking to build a portfolio of high-quality dividend stocks.
Company | Dividend Yield | Years of Consecutive Annual Dividend Growth | Payout Growth Over Past Five Years | Earnings Payout Ratio (From Fiscal 2017) |
|---|---|---|---|---|
AT&T | 6.5% | 34 | 11.1% | 42% |
Apple | 1.3% | 6 | 67.5% | 31.7% |
Realty Income | 4.4% | 48 | 21.3% | 230.4% |
Disney | 1.5% | 8 | 95.3% | 29.5% |
IBM | 5.4% | 23 | 65.2% | 45.5% |
Data sources: AT&T, Apple, Realty Income, Disney, IBM, and Yahoo! Finance.
AT&T
With 34 years of consecutive annual payout increases, AT&T has established a reputation for rewarding its shareholders with regular dividend growth. Signs point to the company's ability to build on that reputation and continue to increase its payout for the foreseeable future. That's an enticing prospect in light of a roughly 6% yield.
AT&T is America's second largest mobile service provider by measure of subscribers, trailing only Verizon. That strong position in the wireless service space allows it to leverage brand strength and benefit from economies of scale to deliver reliable cash flow. The company's wireline internet and telephone and DIRECTV satellite business also allow it to offer bundled service packages that competitors have difficulty matching. That bundling advantage is looking more pronounced on the heels of the company's acquisition of Time Warner, and AT&T has already used Warner's HBO platform as a way to entice users to its wireless service offerings.
Not everything is going in the telecom giant's favor, however. Its share price has been beaten down by factors including competition in the mobile wireless space that's tamping down pricing power, the cord-cutting trend that's hitting the company's DIRECTV satellite television business, and uncertainty over whether the Time Warner purchase will work out -- if, that is, it survives additional challenges from the Justice Department. These are meaningful risk factors, but patient investors have an opportunity to buy a great dividend stock at a low price.
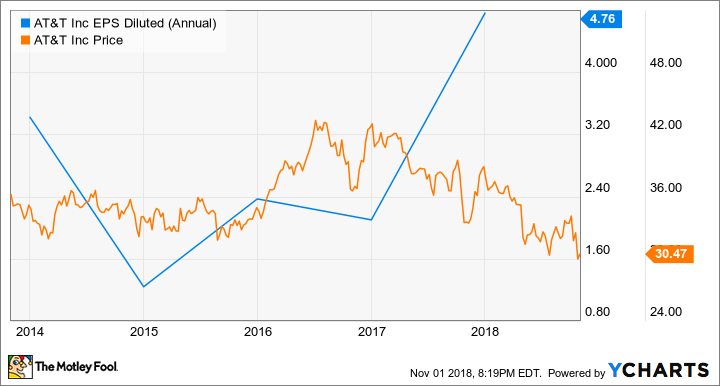
T EPS Diluted (Annual) data by YCharts
As of this writing, shares trade at roughly 6.5 times the company's adjusted 2017 earnings -- another way of saying the company's stock price is 6.5 times higher than its earnings per share for that period. Price-to-earnings (P/E) ratios are calculated by dividing a company's stock price by its recorded or expected earnings over an annual period, and this metric can then be used to compare how a company is valued in relation to the rest of the market.
Stocks on the S&P 500 index had an average P/E ratio of 25 at the beginning of 2018, meaning the average company on the index had a stock price that was 25 times higher than its earnings over the four previous quarters. The telecommunications industry had an average P/E of 10.6 for the period, so AT&T's price-to-earnings value of roughly 6.5 compares favorably with the broader market and its industry.
A company's share price can also be evaluated in relation to free cash flow, and dividing a stock's price by the business' free cash flow will give you a price-to-free-cash-flow (P/FCF) value. Just as with P/E values, low P/FCF values can indicate a stock is a good value. However, investors will also be willing to pay more for companies that are rapidly growing earnings and free cash flow, so a slow-growing company like AT&T that trades at low multiples won't necessarily outperform a stock that's seeing fast EPS or FCF growth.
P/E and P/FCF values can also be thought of as representing how many years of earnings or free cash flow per share at a given annual rate it would take to add up to the company's share price. If AT&T's future adjusted earnings stayed at 2017 levels, it would take roughly six and a half years to generate enough profits to equal its current share price. That low earnings multiple stems in part from one-time benefits from tax overhaul. However, the company will also see long-term benefits from tax reform relating to its privileging of businesses with high capital expenditures in addition to the across-the-board lowering of the corporate tax rates.
Looking ahead, AT&T shares trade at roughly 9 times the midpoint of its earnings target for 2018 and roughly 10.5 times the $21 billion in free cash flow that it expects to generate this year. Those metrics compare favorably with the broader market and the telecommunications industry. Even more impressive, that FCF target doesn't include a contribution from Time Warner, which generated roughly $4.6 billion in free cash flow in 2017.
The cost of distributing AT&T's current payout comes in at roughly 78% of the company's $18.5 billion in 2017 free cash flow and roughly 42% of diluted earnings for the year. That free-cash-flow payout ratio might start to raise a warning flag, given that AT&T will need to continue to invest in its business to take advantage of growth opportunities such as 5G and the Internet of Things. For comparison, Verizon, another stock that income-seeking investors might want to look into, is paying out roughly 33% of its adjusted 2017 earnings and 75% of free cash flow for the period to cover its current distribution -- levels that come in below AT&T's. However, Verizon's dividend yield is also a good bit lower at roughly 4.3%, compared with AT&T's 6.5%.
AT&T will probably grow its dividend at relatively slow rate, but the company is guiding for substantial FCF growth, and hitting its cash flow target for the 2018 fiscal year would put its FCF payout ratio at a more reasonable 70% -- without including the Time Warner contribution.
Apple
With a yield of roughly 1.3%, Apple's dividend component looks small compared with the other stocks on this list, but the company falls soundly in the "dividend growth stock" category. A dividend growth stock is one that's been rapidly increasing its dividend payouts and is expected to continue doing so because of factors such as a strong underlying business and low payout ratios. These stocks often have lower yields than companies that have been paying dividends for longer periods, but they also tend to be increasing earnings faster than more mature companies that offer bigger payouts, and fast dividend growth puts them on track to deliver larger yield in the future.
The company has nearly doubled its dividend since reinstating a payout in 2012, and its last increase came in at a chunky 16%. The cost of distributing its current payout comes in at just 28% of the $50.8 billion in free cash flow the company generated in 2017, and it appears the company's FCF will continue to climb as it grows its services segment and takes advantage of expanding markets, including wearables and connected-home devices.
Apple stands as the world's leading high-end consumer electronics brand and commands pricing power (the ability to charge higher prices without having a pronounced negative impact on demand) that's the envy of its industry. This advantage has allowed the iCompany to command the vast majority of profits in the mobile hardware space despite accounting for a relatively small portion of overall unit sales. Gartner estimates that Apple sold 14% of all smartphones in 2017 -- a share that's already commendable, considering the number of device-makers in the space. However, the real kicker is that the company accounts for the vast majority of mobile hardware profits.
A report from Canaccord estimates that Apple captured 79% of smartphone profits in 2017 and 79% of profits across the full-year period. The iPhone X alone reportedly accounted for 35% of handset profits in the quarter of its release, and a report from Counterpoint Research suggests that Apple made eight out of the 10 most profitable phones in the quarter.
It's not just Apple's hardware business that's more profitable than the competition, either. The company has attracted a high-value consumer base that spends far more on apps and services per user than those on Alphabet's Android mobile operating system. Android devices accounted for roughly 85% of handsets sold in 2017 and roughly 70% of app downloads, but the Apple App Store still accounted for roughly 66% of spending on applications according to App Annie. The company's services segment is highly profitable, generates revenue from both the company's own software and commissions from spending on third-party apps, and continues to grow at a rapid clip. Sales from the services segment climbed 23% in 2017, and growth for the segment is accelerating. That momentum should help the company to continue delivering rapid dividend growth.
Shares traded at roughly 22.5 times the company's diluted earnings per share in 2017. That could look a bit steep if you're operating with the premise that Apple's hardware business is basically mature and doesn't have much room for growth, but the company has continued to beat earnings growth estimates thanks to the strength of its handset business, rapid expansion for its services segment, and the emergence of new growth markets such as wearables. These strong positive catalysts along with the company's already low payout ratio have Apple in good position to continue bolstering its returned income component and make it a dividend stock worth buying and holding on to.

Image source: Getty Images.
Realty Income
Realty Income is a real estate investment trust (REIT), which means it derives most of its sales and income from owning and renting out properties. Unlike many stocks that distribute their dividends on an annual or biannual basis, Realty Income distributes monthly payouts. This is a characteristic that could make the stock an ideal fit for retirement portfolios or those otherwise looking for more frequent income distribution.
Most of Realty Income's sales come from renting standalone retail stores, which could raise some concerns as the brick-and-mortar retail industry is facing substantial tailwinds because of the rise of e-commerce. As people do more of their shopping through online outlets such as Amazon.com, traditional retail outlets are seeing reduced customer traffic, and this trend represents a negative catalyst for companies that rent properties to brick-and-mortar retail outlets.
However, as fellow Motley Fool contributor Matthew Frankel has pointed out, Realty Income's occupancy levels (the percentage of its properties that are rented to commercial lessees) and sales have proved very resilient because of the types of businesses that it rents to. The company boasted a 98.4% occupancy rate at the end of 2017, matching its highest rate within the preceding 10-year period even as it substantially increased its property holdings over the stretch. Most of the company's commercial lessees conduct businesses that should be resilient amid e-commerce trends. These include discount retailers, grocery stores, movie theaters, and drug stores.
Realty Income stock packs a roughly 4.5% dividend yield, and the company has a fantastic history of delivering payout growth. At the end of the company's 2017 fiscal year, it had delivered 4.6% compound annual dividend growth since joining the New York Stock Exchange in 1994 and paid a dividend for 576 months consecutively. Its stock had also delivered an average annual return of 16.3% and seen its payout raised 94 times across the stretch.
Realty Income tends to raise its dividend on a quarterly basis (though 2017 saw the company increase its payout five times) and has raised its dividend for 84 quarters consecutively as of this writing. With a sturdy base of lessees that includes Home Depot, Dollar General, Taco Bell, and CVS Pharmacy, the company is positioned to withstand the e-commerce pressures affecting the broader retail industry and continue returning cash to shareholders. The company closed out its last fiscal year with a 98.4% occupancy rate, the highest level in 10 years.
Paying out its current dividend at an annualized rate would represent roughly 83.5% of 2017's free cash flow and 230% of earnings for the year. Those rates might look high, but they're not really a problem. REITs are required by law to return at least 90% of their taxable earnings to shareholders in the form of dividends. They're also forced to count depreciation (the scheduled reduction of the stated value of a property or asset from factors such as wear and tear) on real estate holdings against earnings, so backing that factor out and using funds from operations (FFO) tends to be a more useful measure. FFO is calculated by taking net income and adding back the depreciated value of assets, the value gained or lost on the sale of properties, and a few other factors to create a metric that better reflects a REIT's performance because real estate tends to increase in value over time. The company recorded $3.06 per share in adjusted FFO, and the cost of covering its forward dividend comes in at roughly 87% of that figure.
With its high yield, great dividend history, and a real estate portfolio built to withstand the growth of e-commerce, Realty Income is a standout choice for income-seeking investors.
The Walt Disney Company
Like Apple, Disney falls into the "dividend growth stock" category. Its roughly 1.5% yield means it's not a great fit for investors looking for big payouts right off the bat, but long-term investors could enjoy substantial dividend growth by booking investment tickets with The House of Mouse. The stock also has the potential to deliver market-crushing capital appreciation (meaning increases in the value of its share price), something that companies that already offer big yields tend to be less likely to do because their businesses are in more mature states.

DIS Dividend data by YCharts
Disney has paid a dividend for over 60 years, has never cut its payout, and has rarely halted payout growth. The big payout drop in 2014 is misleading, as it reflects the company's switch from an annual payment to a semiannual one; the company has nearly doubled its payout over the past five years.
Despite that aggressive payout growth, the cost of covering the company's distribution still comes in at just 29% of the company's 2017 earnings and just 30% of the company's free cash flow for the year. Those low ratios give The House of Mouse plenty of room to continue increasing its payout at a rapid clip while investing to grow the business and ensuring that earnings and FCF continue to move in the right direction over the long term.
While Disney's media networks segment is seeing eroding profitability stemming from cord-cutting trends, rising content costs, and ratings declines at its ESPN network, the company is making moves to address these issues, and the overall business outlook remains promising. The entertainment giant launched ESPN Plus -- an over-the-top (OTT) streaming service that largely features licensed sports broadcasts that would otherwise go unused on its core networks. Disney is going to keep evolving its streaming sports offerings, potentially offering regional sports networks and a full OTT version of ESPN at some point in the future.
The company is also launching its own film-and-television streaming service in 2019. So the Mouse is making moves to keep up with its audience's changing television viewing habits, and its film and theme-park businesses are also looking stronger than ever. With the company having recently received approval from shareholders to acquire entertainment franchises and television networks from Twenty-First Century Fox, its advantage in the content space is more pronounced than ever. No other company can match Disney when it comes to valuable entertainment franchises, and that advantage, combined with the likelihood of sustained payout and profit growth, has the stock looking attractive trading at roughly 20 times last year's earnings.
International Business Machines
IBM is less flashy than its high-growth peers in the tech sector, but its stock offers a great all-around value -- especially for income-seeking investors. Shares trade at a low earnings multiple and offer a big yield backed by a great history of dividend growth -- and the company's reasonable payout ratios suggest that it should be able to continue adding to its fantastic track record of delivering regular dividend growth.
Shares come with a chunky 5.3% yield at current prices -- higher than it's been at any time in the past 20 years, and investors can look expect shares purchased today to deliver an even bigger yield down the line.

IBM Dividend Yield (TTM) data by YCharts
IBM has increased its payout on an annual basis for 23 years running. The company has paid a dividend for 116 years uninterrupted -- a history that stretches back to before the business operated under the name International Business Machines. That's a track record that has made dependable income generation and regular payout growth an ingrained part of stock ownership, and shareholders probably don't have to worry that management will reduce or suspend the distribution any time in the foreseeable future.
The company generated $13 billion in free cash flow in its 2017 fiscal year, returning $5.5 billion to shareholders in the form of dividend payments and another $4.3 billion in the form of stock buybacks. Even after raising its payout by 4.7% in April 2018, the cost of distributing its forward dividend comes in at just 48% of the company's 2017 FCF and 44.5% of the year's adjusted earnings. Those payout ratios look even better because IBM's pivot away from its declining hardware and services products and toward a more cloud-focused business appears to have finally turned the corner.
The company entered 2018 having reported 22 consecutive quarters of year-over-year sales declines, but growth for the company's cloud, security, analytics, and mobile businesses has helped it break that unenviable streak and presented a path to sustainable growth. It's not unreasonable to expect some additional bumps in the road, but long-term investors have an opportunity to purchase a great dividend stock with underappreciated growth potential at a discount. Shares trade at roughly 8.5 times the company's adjusted earnings for 2017, a valuation that leaves room for substantial capital appreciation if the business keeps its turnaround on track.
Key risks of dividend investing
Dividend stocks tend to be safer than those that don't pay a dividend, because returning income to shareholders on a consistent basis typically requires dependable earnings and cash flow. But that doesn't mean they are risk-free investments. As with other companies, a business that pays dividends still faces threats from competitors and shifting demand for its products and services. If the underlying business falters, a company might no longer be able to distribute payouts to shareholders, and this change can result in steep declines for its share price. With a weakened business, a sunken stock price, and the lack of regular dividends flowing to shareholders, a formerly safe-looking income investment can see its value wiped out and shareholders left in the red.
Rising interest rates can also pose a threat to the stock performance of dividend-paying companies. As interest rates increase, investors may move out of dividend stocks in favor of other income-generating investments such as bonds or savings accounts, because these vehicles are generating improved returns while presenting less risk than stocks. If the market moves away from dividend stocks, depressed share prices should also have the effect of increasing yield. Rising yield can then cause investors to pile back in and have a stabilizing effect on share prices at a certain level, but investors can still wind up with stocks that underperform the market or are valued well below their initial purchasing price.
Even with these risks, buying and holding high-quality, income-generating stocks for the long term has helped investors of all ages and backgrounds build wealth and achieve their financial goals. Dividend-paying stocks are often favored by retirees or those investing for their non-working years, and while these groups aren't the only ones to benefit from income investing, it's not hard to see why. The power of compounding dividends can help investors build a sizable nest egg, and regular cash payments provide another source of income for people who are retired, but companies with strong businesses that pass some of the prosperity along to investors through dividends can have a beneficial impact on any investor's portfolio.
More From The Motley Fool
John Mackey, CEO of Whole Foods Market, an Amazon subsidiary, is a member of The Motley Fool's board of directors. Suzanne Frey, an executive at Alphabet, is a member of The Motley Fool's board of directors. Keith Noonan owns shares of AT&T, IBM, and Walt Disney. The Motley Fool owns shares of and recommends Alphabet (A shares), Alphabet (C shares), Amazon, Apple, and Walt Disney. The Motley Fool has the following options: long January 2020 $150 calls on Apple, short January 2020 $155 calls on Apple, short February 2019 $185 calls on Home Depot, and long January 2020 $110 calls on Home Depot. The Motley Fool recommends CVS Health, Gartner, Home Depot, and Verizon Communications. The Motley Fool has a disclosure policy.

