3 Big Stock Charts for Wednesday: Procter & Gamble, FMC and SBA Communications
The market logged its fourth straight gain on Tuesday, with the S&P 500 advancing 0.28% to end the session at 2,858.45. That’s not quite a record high, but certainly pulled the index to within striking distance of January’s peak.
Tesla (NASDAQ:TSLA) did the bulk of the heavy lifting, rising 11% on news that CEO and major shareholder Elon Musk may be taking his company private. And the marketwide gain overcame some dead weight. Facebook (NASDAQ:FB) fell a percentage point as investors remembered subscriber growth is slowing … an undertow that was underscored by the fact that Snap (NASDAQ:SNAP) also saw its number of regular users shrink last quarter.
Broadly speaking, the day’s winners were far more bullish than they usually are, while the day’s losers were far more bearish than we’d normally expect to see — a trend that has been in place for a while. It’s also a trend that rewards disciplined trading rather than coin tosses.
InvestorPlace - Stock Market News, Stock Advice & Trading Tips
To that end, stock charts of Procter & Gamble (NYSE:PG), FMC (NYSE:FMC) and SBA Communications (NASDAQ:SBAC) weren’t all that erratic on Tuesday. Rather, they’ve all three been laying the groundwork for bigger moves ahead. Here’s what needs to happen next.
Procter & Gamble (PG)
One week ago, we pointed out the budding bullishness from Procter & Gamble. Since then, the follow-through has been impressive.
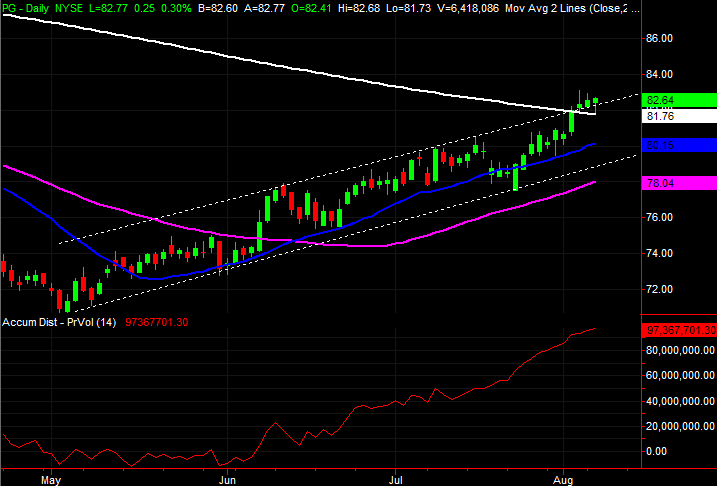
PG stock is up 2.5% since then, which isn’t much, but it was a very important 2.5%. Thanks to that advance, P&G shares have worked their way above some key technical resistance.
• One of those ceilings is the upper edge of the rising trading range (dashed) that has framed the uptrend since May. The other is the 200-day moving average line (white).
• Perhaps more important, Procter & Gamble shares peeled back a little on Tuesday to test the 200-day moving average line as support, and did indeed find support there. The stock ended up snapping back to close at a multiweek high.
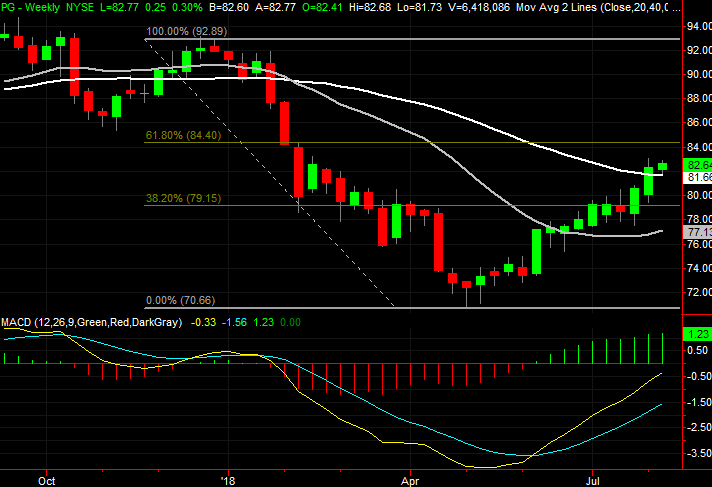
• As before, there’s a natural technical ceiling at $84.40, where a 61.8% Fibonacci retracement line of the entire span of the December/May pullback lies. That’s likely to be a point of contention if the stock continues to rally — and it looks like it will.
FMC (FMC)
With just a quick glance at FMC shares, it doesn’t look like the chemical company is in too much trouble. And truth be told, it isn’t … yet.
A second, closer look at both stocks charts of FMC, though, reveals there’s more trouble brewing here than is evident with just a quick glance. One or two more missteps could set off something of a selling avalanche.
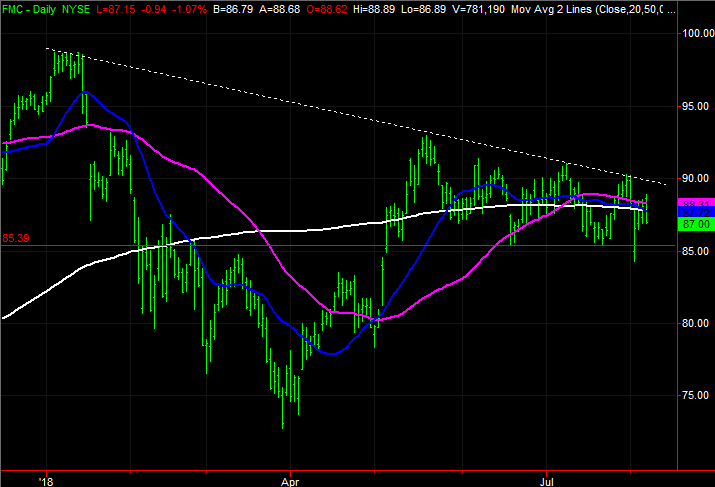
• It’s subtle, almost to the point of being negligible, but on the daily chart the 20, 50 and 200-day moving averages are all sloped downward, and FMC shares are below all of them. They were guided there by a falling resistance line (dashed) that goes all the way back to the early 2018 peak.
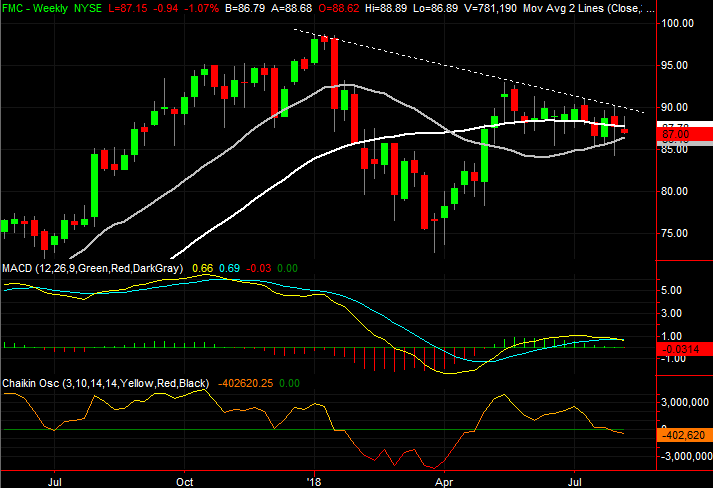
• On the weekly chart, not only do we now have a bearish MACD divergence, we’ve also seen the Chaikin line break back below the zero level. That’s a hint that there’s more than a little bearish volume behind this downtrend.
• A break below the recent low near $85.39 is a key to unleashing the full selloff potential of FMC.
SBA Communications (SBAC)
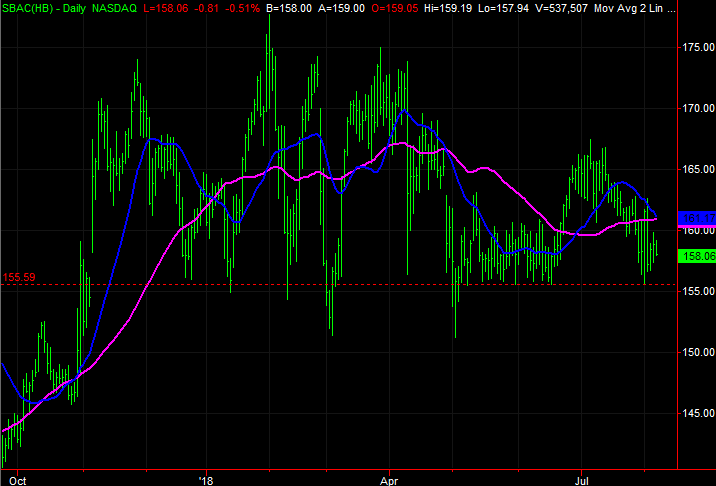
Finally, the second-quarter report from SBA Communications posted last week wasn’t bad. It wasn’t good, but certainly not devastating. But, the fact that SBAC stock simply, ultimately, continued to develop a long-standing downtrend suggests traders were bearish heading into the report, and had already decided to remain bearish barring any major pleasant surprise.
That sets the tone for the stock going forward. But, that tone won’t take a turn for the worse until a major technical floor is broken.
• That technical support level is $155.59, where SBAC found a floor for the better part of late May and early June, and then kissed in late July.
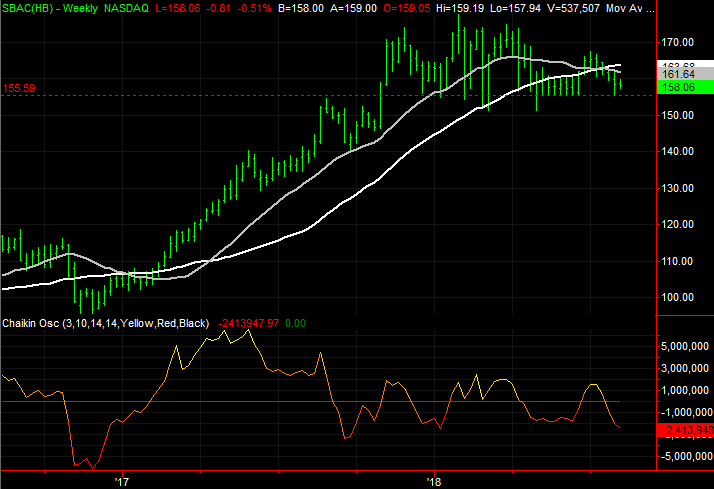
• On the weekly chart, the 100-day moving average line (gray) has pulled below the 200-day moving average line (white), underscoring the brewing pullback.
• Should the floor at $155.59 snap as support, there are no notable potential floors in sight that have a great shot at stopping the bleeding with any ease.
As of this writing, James Brumley did not hold a position in any of the aforementioned securities. You can follow him on Twitter, at @jbrumley.
More From InvestorPlace
The post 3 Big Stock Charts for Wednesday: Procter & Gamble, FMC and SBA Communications appeared first on InvestorPlace.

