3 Big Stock Charts for Tuesday: DowDuPont, D. R. Horton and NVIDIA
Another day, another gain. That’s three in a row for the S&P 500, up 0.24% on Monday, moving within reach of a new multi-month high. Then again, this has been a market that loves to zig just when it looks like it’s going to zag. The fact that Monday’s bullish volume was so light can’t be ignored.
Sodastream International (NASDAQ:SODA) was the day’s fizziest name, bubbling up more than 9% on the heels of news that it was being acquired by PepsiCo (NYSE:PEP). Mostly unknown Tilray (NASDAQ:TLRY) did even better, however, rising 17% after the marijuana stock finally found the tailwind it has been waiting for since its IPO last month.
Only time will tell if Monday’s biggest winners are inspiring enough to keep the ball rolling higher. Broadly speaking though, they probably aren’t. That puts the focus on the stock charts of Nvidia (NASDAQ:NVDA), DowDuPont (NYSE:DWDP) and D. R. Horton (NYSE:DHI), which have quietly moved into positions that could very likely lead to trade-worthy moves … even if not necessarily bullish ones. Here’s what traders need to know.
InvestorPlace - Stock Market News, Stock Advice & Trading Tips
Big Stock Charts: Nvidia (NVDA)
The apparent disconnect of talking bearishly about one of the market’s most rewarding stocks for the past couple of years is fully acknowledged. Nvidia — the company — has been performing exceedingly well since 2016, and the stock has followed suit. There comes a time, however, when a rally runs out of gas.
That’s not apt to be a popular opinion of market-darling NVDA right now, and it’s entirely possible the stock will end up sidestepping the bearish clues starting to form. It would be wrong to not consider all possibilities though, and look at Nvidia’s proverbial point of no return.
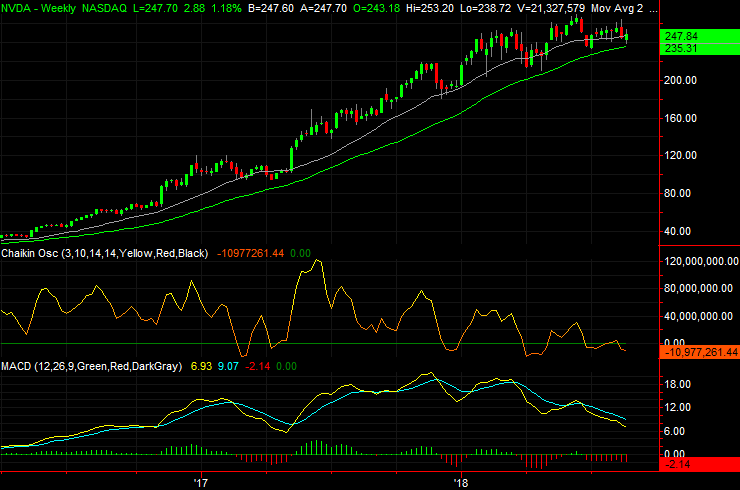
• The weekly chart of NVDA serves two purposes. The first one is just for perspective on last year’s big rally that’s left the stock ripe for profit-taking. The second purpose is to make clear that the falling, and bearish, MACD lines clearly say things aren’t flowing like they were last year.
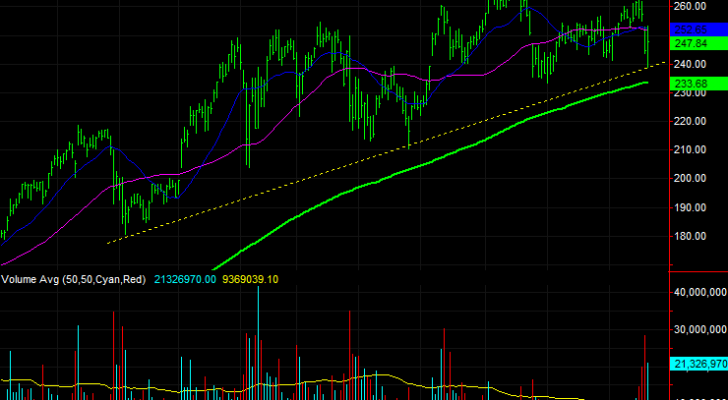
• Although NVIDIA shares ended Monday with a gain, they only did so after a rather bearish open that tagged and further defined a technical support line (yellow, dashed) extending back to late last year. Also not that Monday’s rebound wasn’t on especially strong volume.
• Though that straight-line floor is important, the last-ditch support level is going to be the 200-day moving average line (green) at $233.686.
Big Stock Charts: DowDuPont (DWDP)
If DowDuPont rings oddly familiar, there may be a reason. It was one of the stock charts we dissected back on July 27, noting how a rising support line was brewing up a possible breakout move.
That breakout thrust hasn’t taken shape … yet. But, the underpinning are firming up, and it’s becoming clear what’s holding it back and when and where DWDP shares could be unleashed.
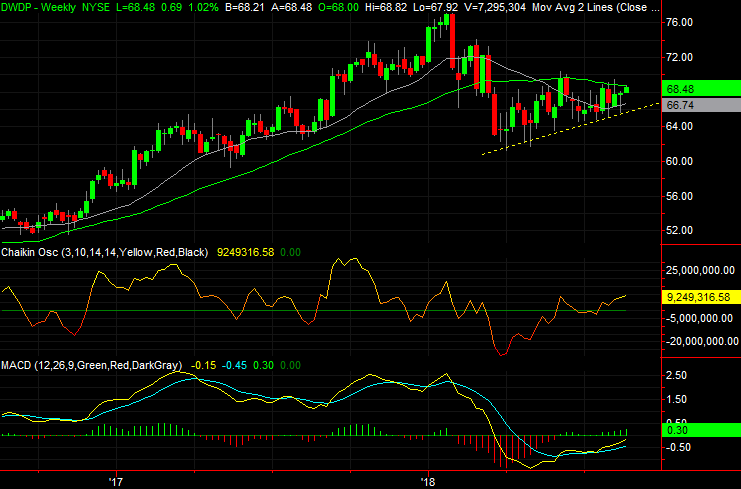
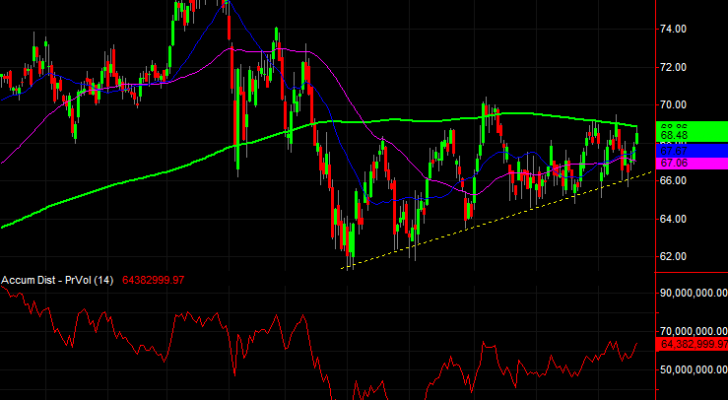
• The crux of the potential bullishness is the rising support line (yellow, dashed) that tags all the key lows going back to the early April bottom. The weekly chart has dished out — or more accurately, renewed — a bullish cross since DWDP started to ride this rising support line.
• Since then, the 200-day moving average line has emerged as technical resistance. That’s OK though. While it’s holding the stock back, if and when it fails to keep DowDuPont stock contained there will be very little left to hold the stock back.
• Should the break above the 200-day average take shape, that thrust is likely to unfurl at a pretty rapid pace, given how long the stock has been building up steam between a narrow range of support and resistance.
Big Stock Charts: D. R. Horton (DHI)
Last but not least, the home-construction market has been less than thrilling of late. The last few starts and permits reports have been less than thrilling, boding poorly for the industry.
And yet, shares of homebuilder D. R. Horton appear to be in recovery mode. As uncomfortable as it may feel to trade against the headlines, the “smart money” move is responding to what the tape is telling you. DHI just has one more big hurdle to clear.
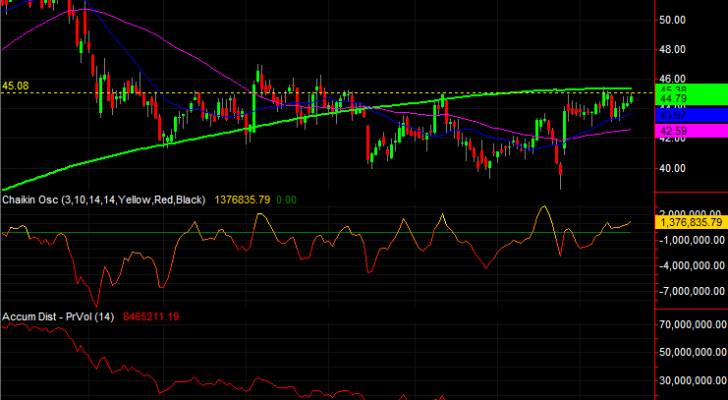
• D. R. Horton shares took a big hit early in the year, falling 26% from high to low before recovering. Though up a little since July’s low, the bulk of that pullback can still be made up.
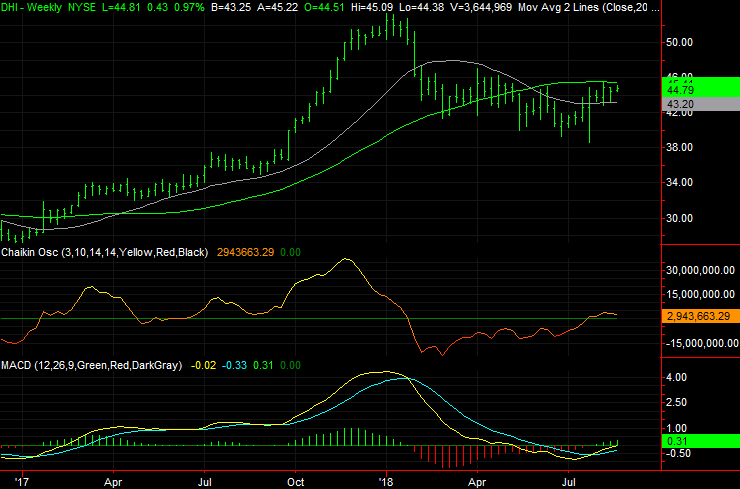
• The momentum, and volume, are both bullish. Both the weekly and the daily stock charts show us that bullish volume is growing, and we’ve got a bullish MACD cross in the rearview mirror of the weekly chart.
• The big line in the sand is actually the combination of two lines more or less in the same place. The 200-day moving average line (green) at $45.38 has been and likely still is a ceiling just like it’s been a floor in the recent past. But, there’s also a horizontal ceiling at $45.08.
As of this writing, James Brumley did not hold a position in any of the aforementioned securities. You can follow him on Twitter, at @jbrumley.
More From InvestorPlace
The post 3 Big Stock Charts for Tuesday: DowDuPont, D. R. Horton and NVIDIA appeared first on InvestorPlace.
