3 Big Stock Charts for Friday: Nektar Therapeutics, Waters and A.O. Smith
All things considered, it can’t be terribly surprising Wednesday’s tepidness turned into an outright pullback — albeit a modest one — on Thursday. The bullish volume needed to keep a rally going never really materialized. With the proverbial tank running on empty, the S&P 500 was lucky to have not pulled back more than the 0.14% it did.
Advanced Micro Devices (NASDAQ:AMD) proved to be the greatest drag, falling 2.5% as the weight of its recent gains continues to bear down. But, Tesla (NASDAQ:TSLA) was the biggest noteworthy loser, sliding nearly 5% as doubts about the company going private have begun to surface.
That doesn’t necessarily mean all trades from here have to be bearish ones. As the following stock charts of Nektar Therapeutics (NASDAQ:NKTR), Waters (NYSE:WAT) and A.O. Smith (NYSE:AOS) indicate, some stocks are still well-positioned to move higher. Others aren’t.
InvestorPlace - Stock Market News, Stock Advice & Trading Tips
Nektar Therapeutics (NKTR)

Most of the time, diving into a stock after a volatile intraday move isn’t a good idea. There’s just not enough certainty about how the market will feel the next day, when emotions have settled down.
Nektar Therapeutics, though, is an exception to that rule of thumb. The fact that the stock initially reacted poorly to its second quarter numbers and then rebounded for a solid gain says the bulls are in charge even though the bears had their chance to topple it.
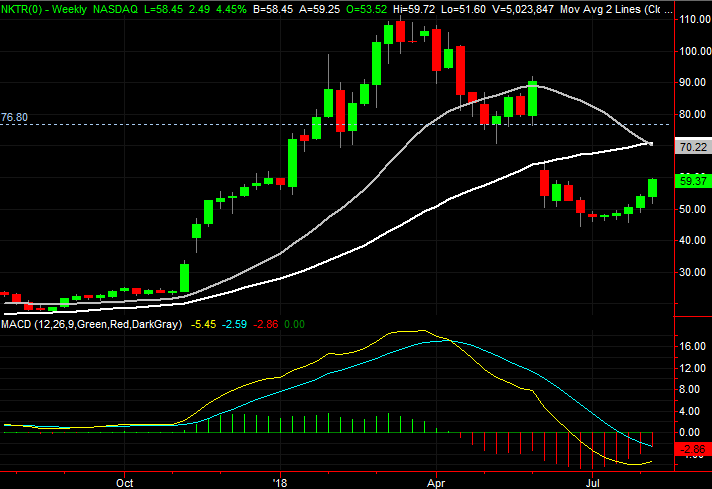
• Yesterday’s daily bar is an engulfing bar, meaning the open and close were both below and above Wednesday’s entire low-to-high action. Engulfing bars often indicate sweeping change, though in this case, the bulls were already moving into the stock for a couple of weeks heading into the Q2 report. The bulls were ready to see the news in a bullish light.
• A careful look at the daily chart also makes clear that Nektar Therapeutics shares found support at key short-term moving average lines, which is where you’d expect/want to find support.
• The weekly chart puts the big setback that set up this new uptrend in perspective. At the very least the buyers appear willing to try and close the gap left behind in early June. That gap’s upper value is $76.80.
Waters (WAT)

With nothing more than a quick glance, Waters just looks like a volatile mess. A second, longer look though, reveals things aren’t quite that simple. Buried within the erraticness are hints that the sellers are coming out of the woodwork even if we see occasional flashes of brilliance.
One or two more bad days could clarify those troubling hints, but it may be too late to act then.
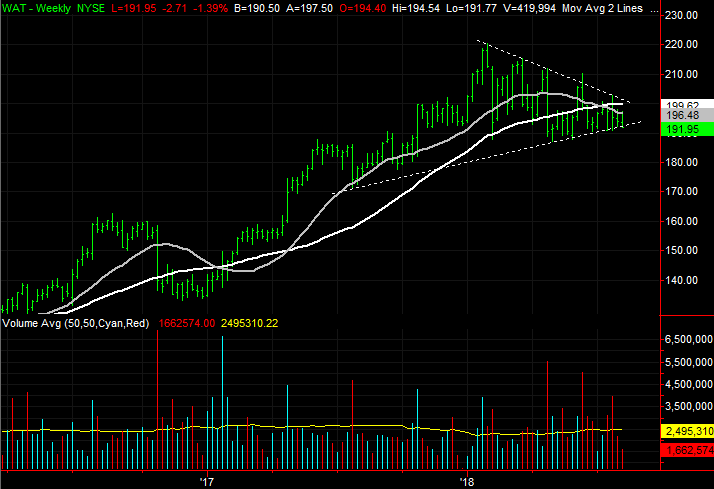
• A careful look at the daily chart shows a head-and-shoulders pattern has not only taken shape, but that the neckline was just broken. Granted, it’s not an ideal head-and-shoulders pattern, but they never are. The underlying spirit of the pattern says the bulls are increasingly bowing out, and the bears are increasingly emboldened.
• Backing out to a weekly chart of Waters, we can see that the last few months are all part of converging wedge pattern, the lower boundary of what actually extends back to the middle of last year. Sooner or later (and likely sooner than later), WAT is going to break out of this narrowing range.
• The current trend and volume clues suggest the bears are in charge, and ready to tip the chart over. Once the floor plotted on the weekly chart snaps, though, there’s not much left in the way of floors that will hold back a wave of selling.
A.O. Smith (AOS)
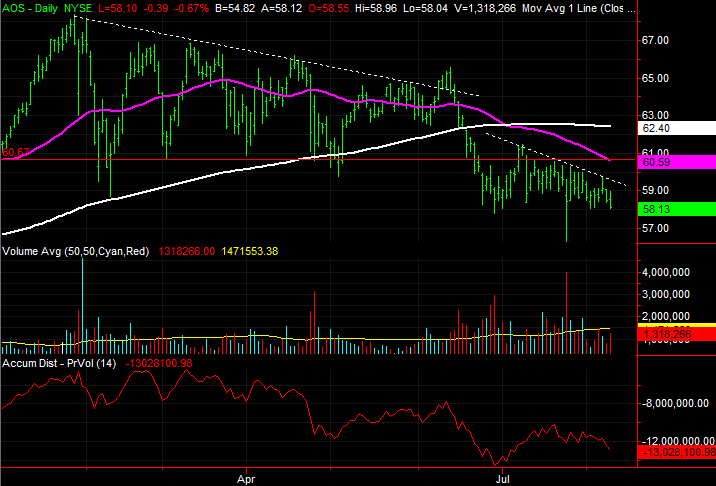
For a while last month it looked like A.O. Smith would find a way of regrouping from June’s meltdown. But, just within the past few days, the stock has started to drift lower, testing the waters of lower lows. Thursday’s close of $58.13 was the lowest in weeks, and the bears never looked back.
Unfortunately, the hint to take here is a bearish one.
• This bigger-picture downtrend is well-developed, with the 200-day moving average line now pointed in a downward direction. Helping guide the stock lower is a falling resistance line that’s developed just since July, marking every peak AOS has made since then.
• There’s more bearish volume than bullish volume on the table too. The accumulation-distribution line has rolled over again.
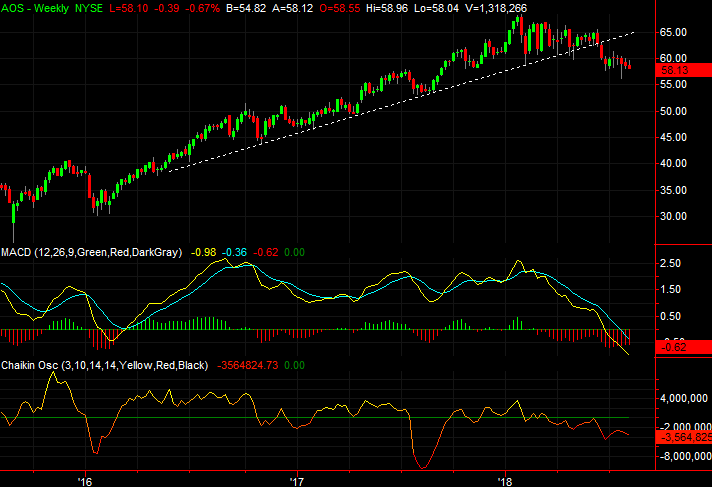
• Zooming out to the weekly chart of A.O. Smith we can see the scope of this pullback. The rising support line that guided the stock upward since mid-2016 was also snapped in June. The sellers never looked back from that bigger-picture meltdown either.
As of this writing, James Brumley did not hold a position in any of the aforementioned securities. You can follow him on Twitter, at @jbrumley.
More From InvestorPlace
The post 3 Big Stock Charts for Friday: Nektar Therapeutics, Waters and A.O. Smith appeared first on InvestorPlace.

